Chapter 11 Using theme() to make it look good!
11.1 Introduction to themes
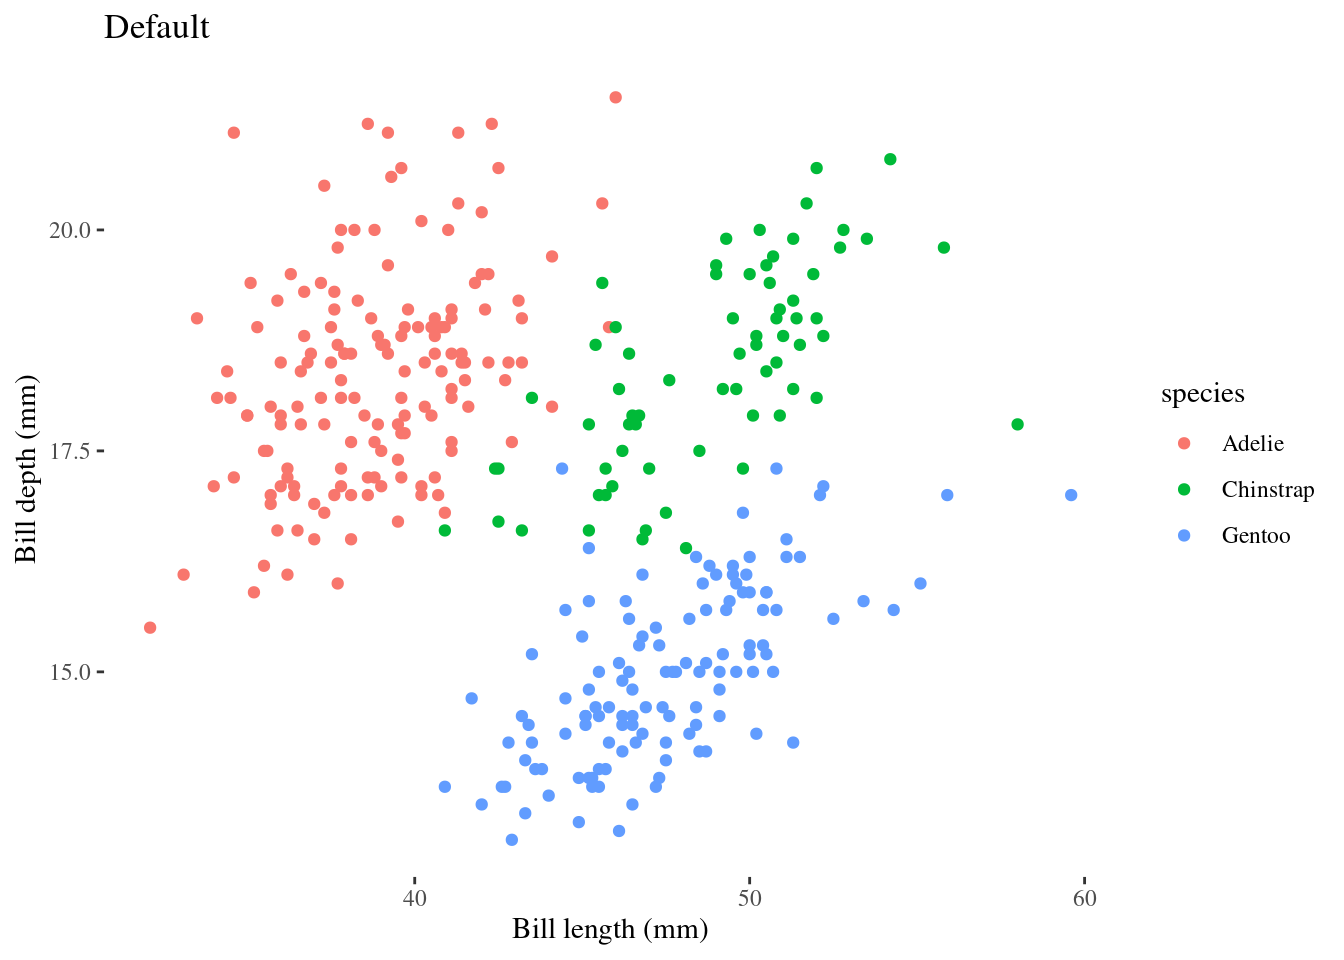
This book has been using theme_classic() for the plots, because the default grey background can make certain colours harder to see.
But, like every other part of the grammar of graphics, we can modify the theme of the plot to suit our needs, or higher sense of style!
There are way too many theme elements built into the ggplot2 package to mention here, but you can find a complete list in the theme vignette. Instead of
modifying the many elements contained in theme(), you can start from theme functions, which contain a specific set of elements from which to start. Here are some examples:
11.1.1 Default: Grey
# Theme grey
pp + scale_colour_grey() + # Make data points gray
  theme_grey() + # Make background gray
  labs(title = "Default: Grey") # Title plot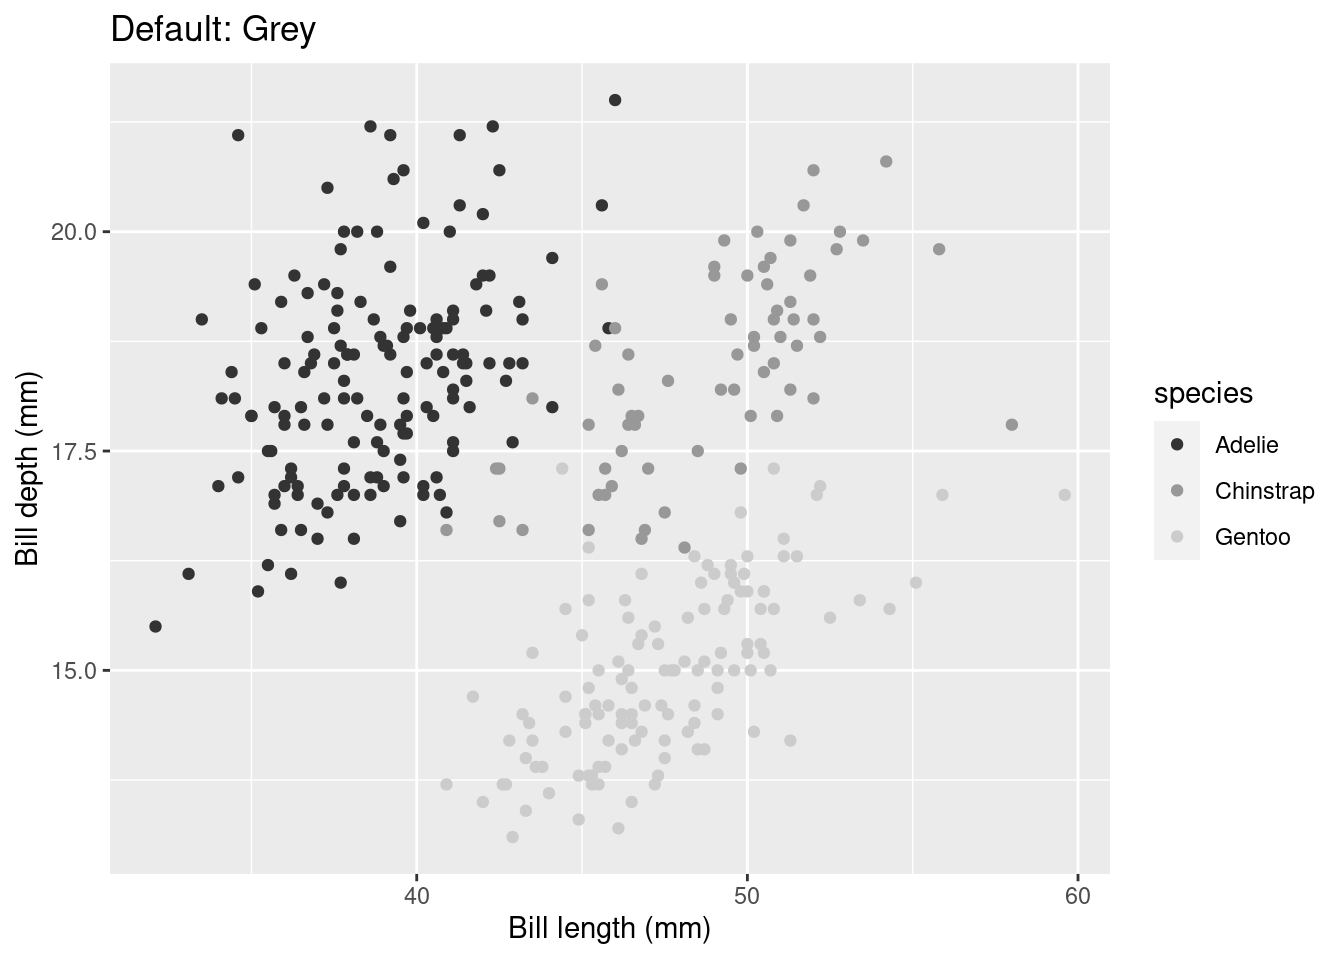
11.1.2 Theme Classic
pp + scale_colour_grey() +# Make data points gray
  theme_classic() + # Make background white
  labs(title = "Classic") # Title plot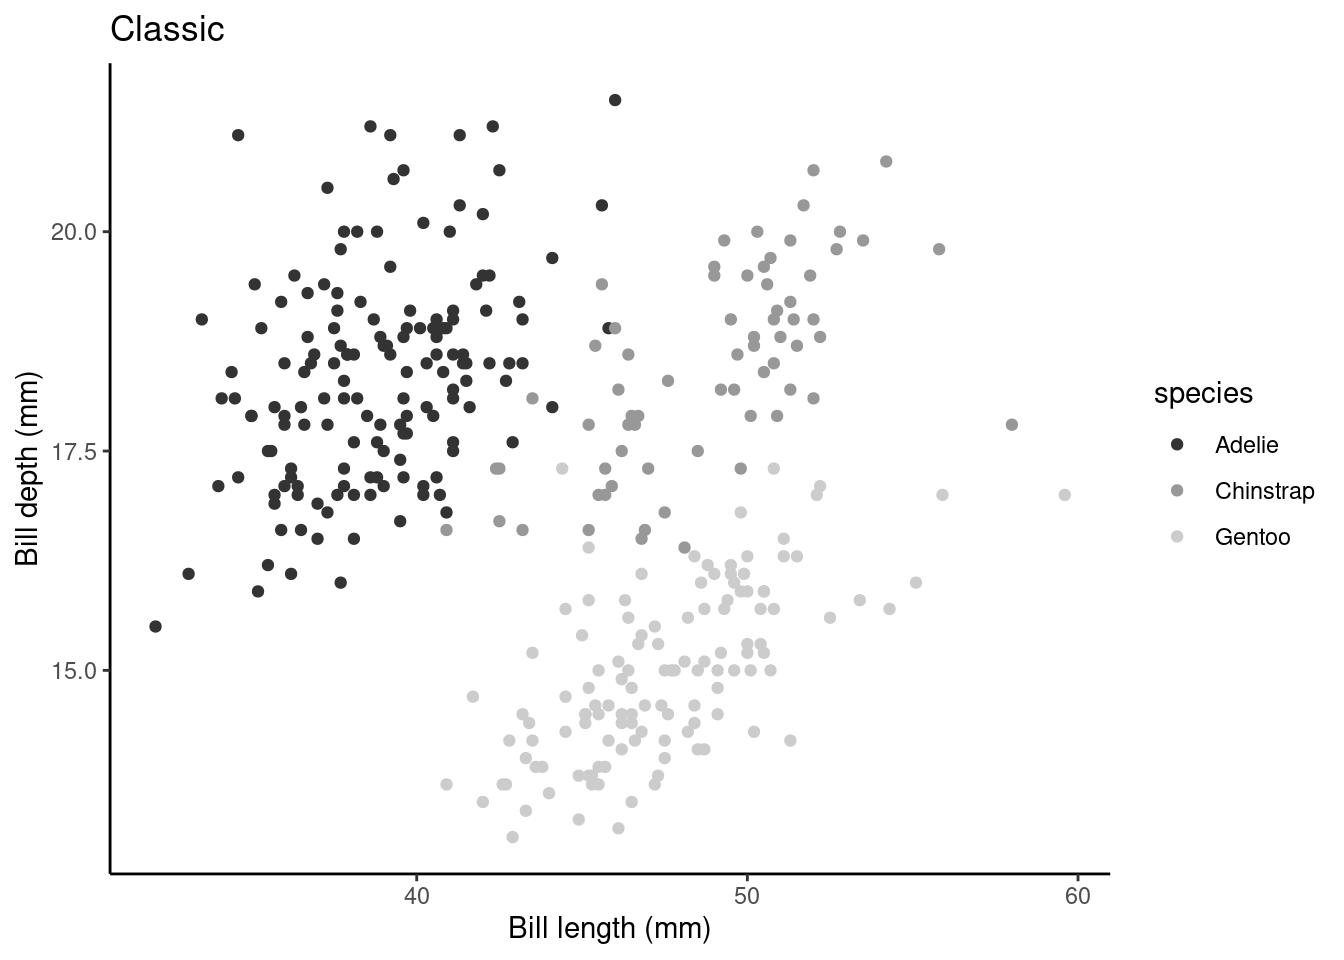
11.1.3 Theme Minimal
pp + scale_colour_grey() +
  theme_minimal() + # Make background white with gray gridlines
  labs(title = "Minimal")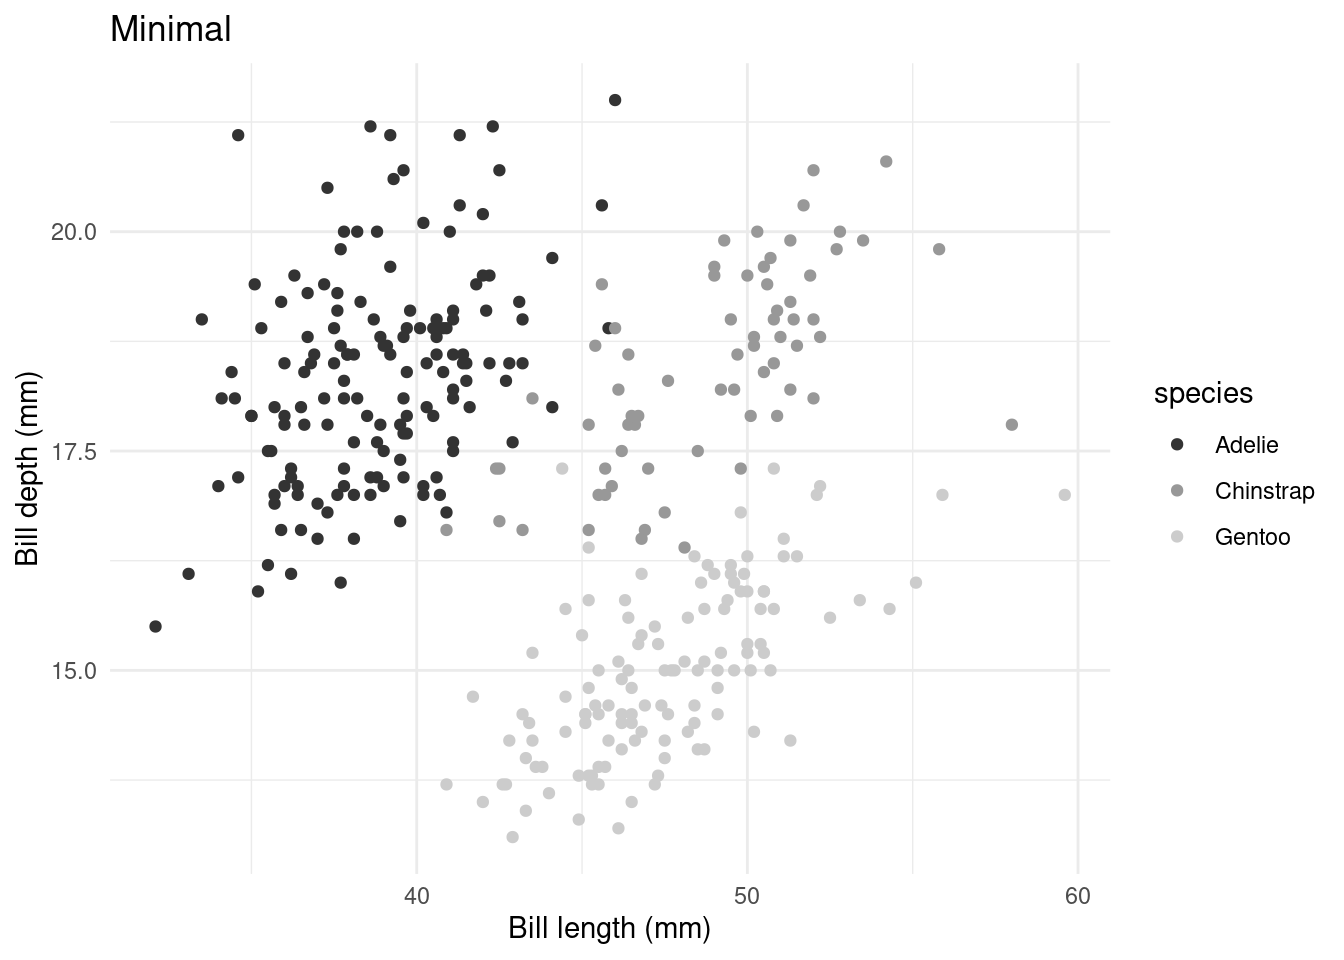
11.1.4 Setting the theme across all plots
As you may have noticed, ggplot code can quickly become long when you constantly need to specify the characteristics of the theme you want to use. When you are making multiple plots and want them to all have the same theme, you can simple use theme_set() to set the theme for all plots that are generated afterwards, or theme_update() to edit elements of an existing theme setting without rewriting all the other theme elements.
11.1.4.1 Setting a theme
# Set black & white theme as default
theme_set(theme_bw())  # Note the background is white with a black frame
pp
After using theme_set(), our pp plot is generated with the black & white theme theme_bw(). Any future plots generated in your R session would also be generated with this theme.
11.1.4.2 Updating a theme
Perhaps the minor gridlines are not necessary for this plot, though we like everything else about our theme. Rather than rewriting several lines of code to respecify the theme, we can simply use theme_update() to adjust a specific element of our theme.
# remove minor gridlines
theme_update(panel.grid.minor = element_blank())  # Adjust gridline scale
pp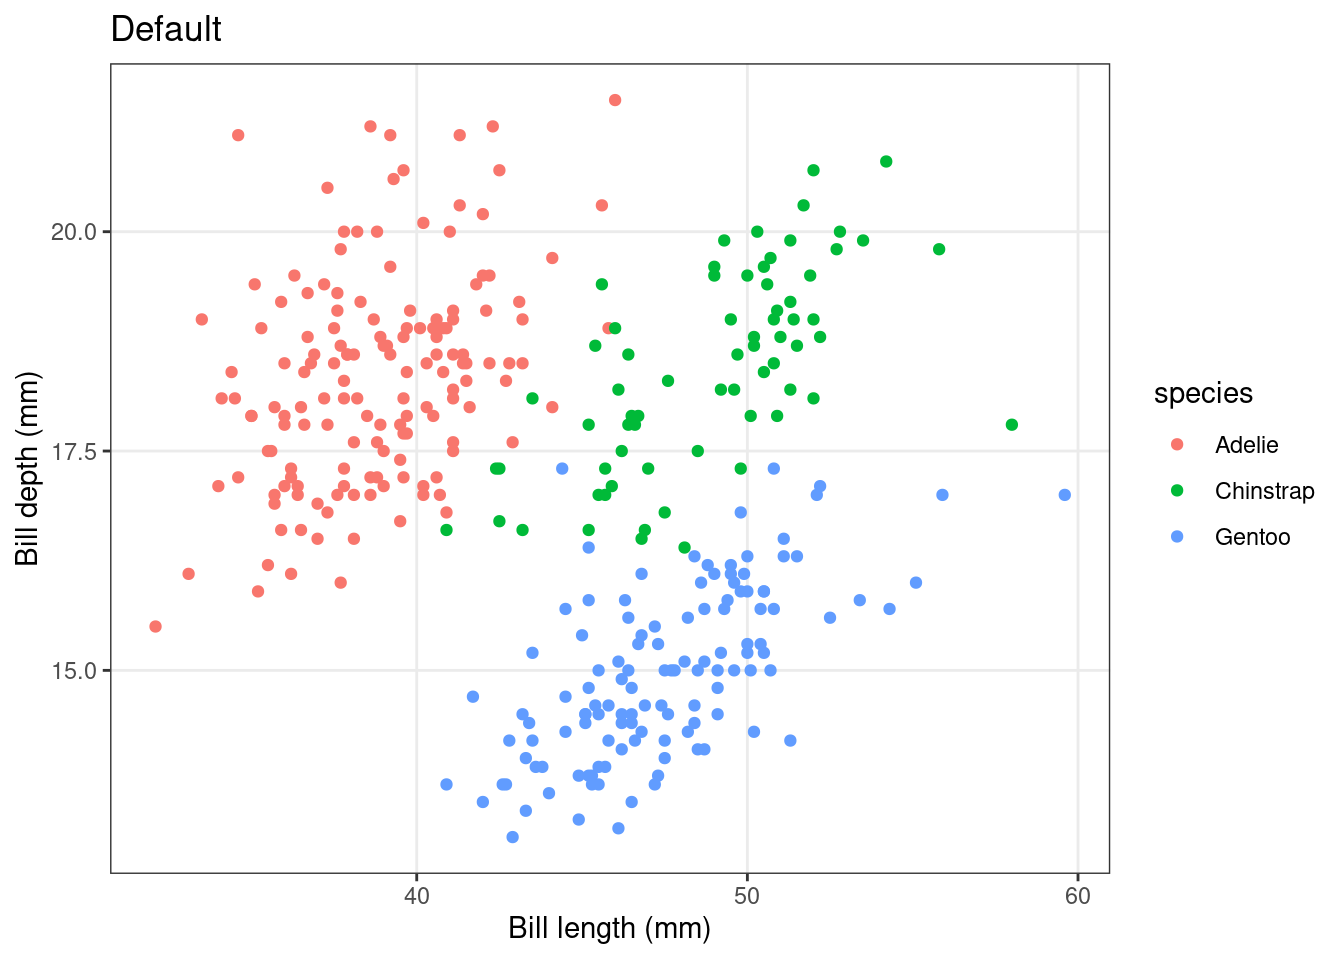
There! Much better!
11.2 Elements of a theme
Here is a helpful infographic to help you customize your theme to fit your exact needs!
).](images/ggthemes.png)
Figure 11.1: ggplot2 theme reference sheet by Isabella Benabaye (source).
11.3 Building your own theme
Once you become more comfortable with customizing existing ggplot themes, you might want to think about creating your own theme to add to your plots. This is a great way to make your plots stand out in a presentation, a publication, a website, or wherever else they find a home!
Here is an example:
mytheme <- theme_bw() + # You can start from an existing theme to get some of the basic elements set up
           theme(plot.title = element_text(colour = "red")) +
           theme(legend.position = c(0.9, 0.9))
pp + mytheme # Apply it to your plot!
11.4 More themes
The ggthemes package is a great project developed by Jeffrey Arnold on GitHub and also hosted on the CRAN repository. The package contains many themes, geoms, and colour ramps for ggplot2 which are based on the works of some of the most renown and influential names in the world of data visualization, from the classics such as Edward Tufte to the modern data journalists and programmers at FiveThirtyEight blog.
The package can be installed as follows:
install.packages("ggthemes")
library(ggthemes)
We can then apply some of these themes (and more) to our plot!
# Let's use the FiveThirtyEight blog's theme, and Tableau's
# color palette
pp + theme_fivethirtyeight() + scale_color_tableau()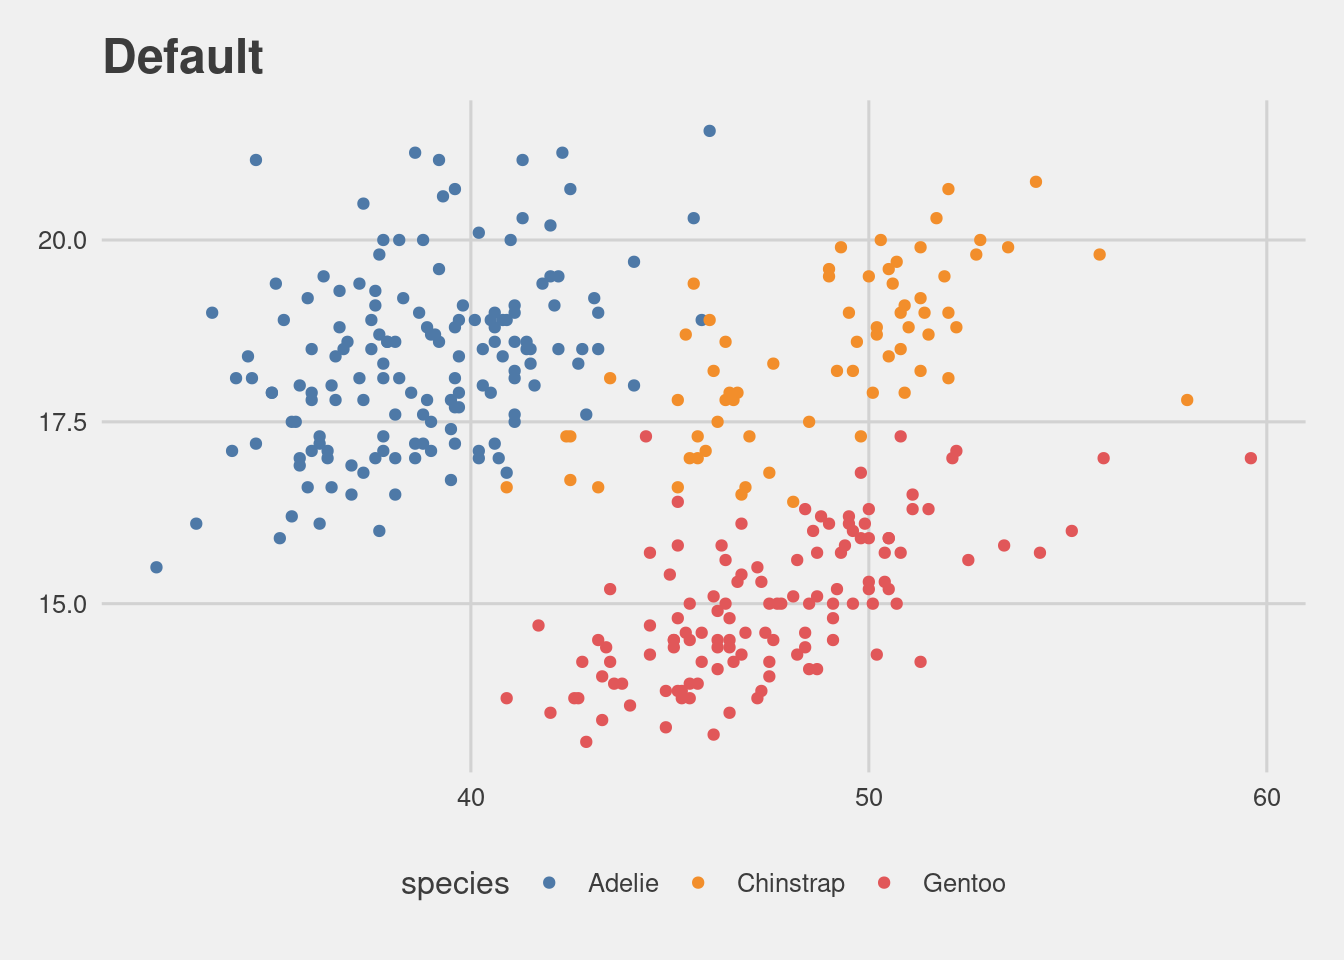
# Let's use Tufte's 'Maximal Data, Minimal Ink' theme
pp + theme_tufte()