Chapter 9 Changing shape, size and alpha
Now let’s look beyond colour! If we want to change the shape of our data points, we can start by using the shape argument within the aes() layer just like we did with colour. This will group our data points by the variable we provide using different shapes (here we are using the variable species).
If we want to adjust the size of the data points instead, we can use the size argument in the same spot. We can also use the alpha argument if we want to play with transparency. Both of these are good options for continuous data.
# shape for groups
ggplot(data = penguins) +
  geom_point(aes(x = bill_length_mm,
                 y = bill_depth_mm,
                 shape = species)) + # Group data with data point shape
  labs(title = "Shapes for groups")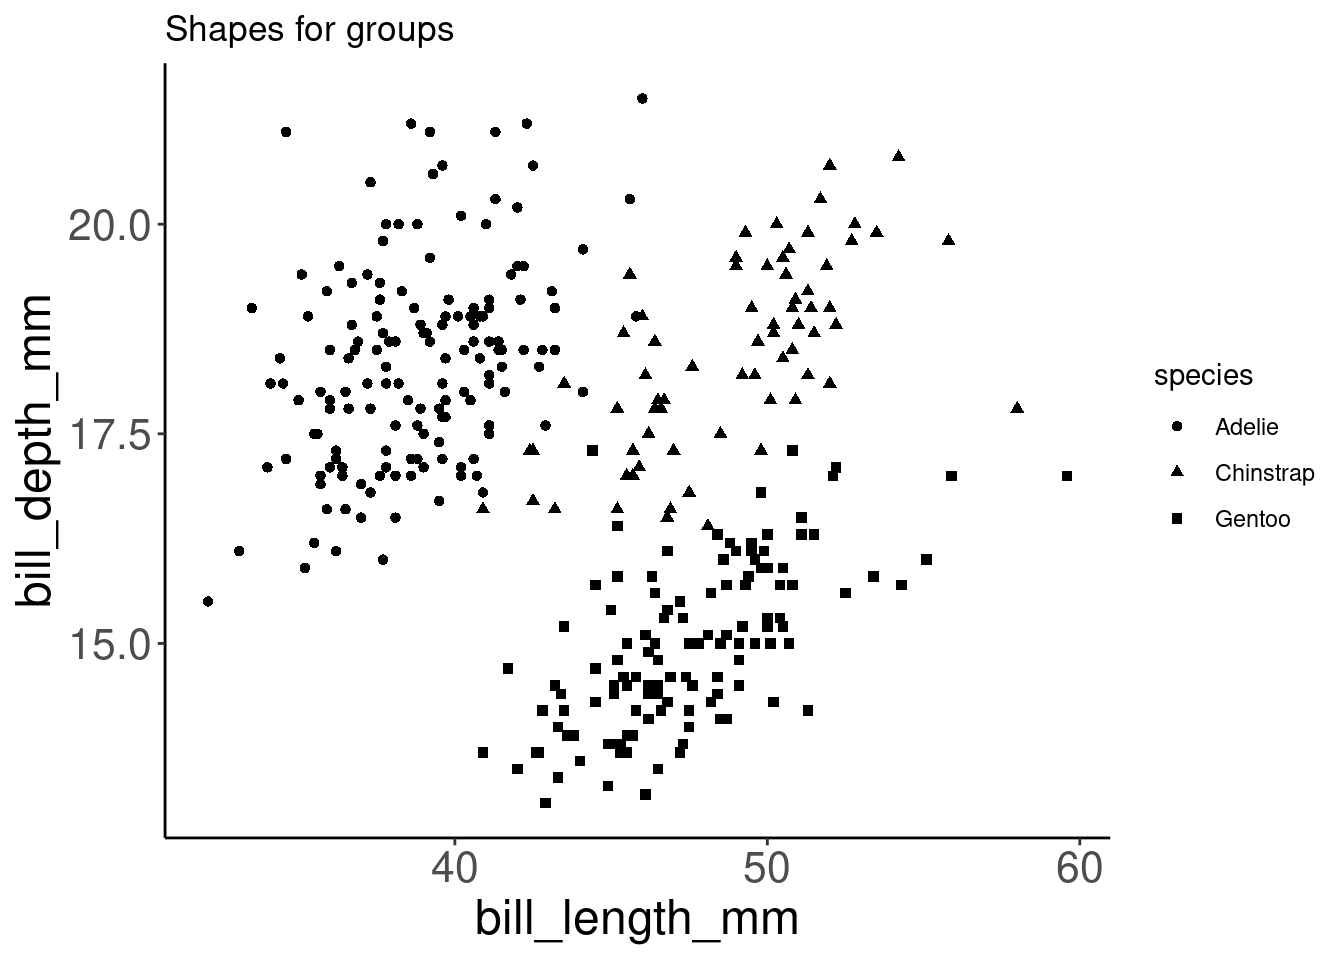
# size and alpha for continuous values
ggplot(data = penguins) +
  geom_point(aes(x = bill_length_mm,
                 y = bill_depth_mm,
                 size = body_mass_g,# Group data using point size
                 alpha = flipper_length_mm)) + # Group data using transparency
  labs(title = "Size and alpha for continuous values")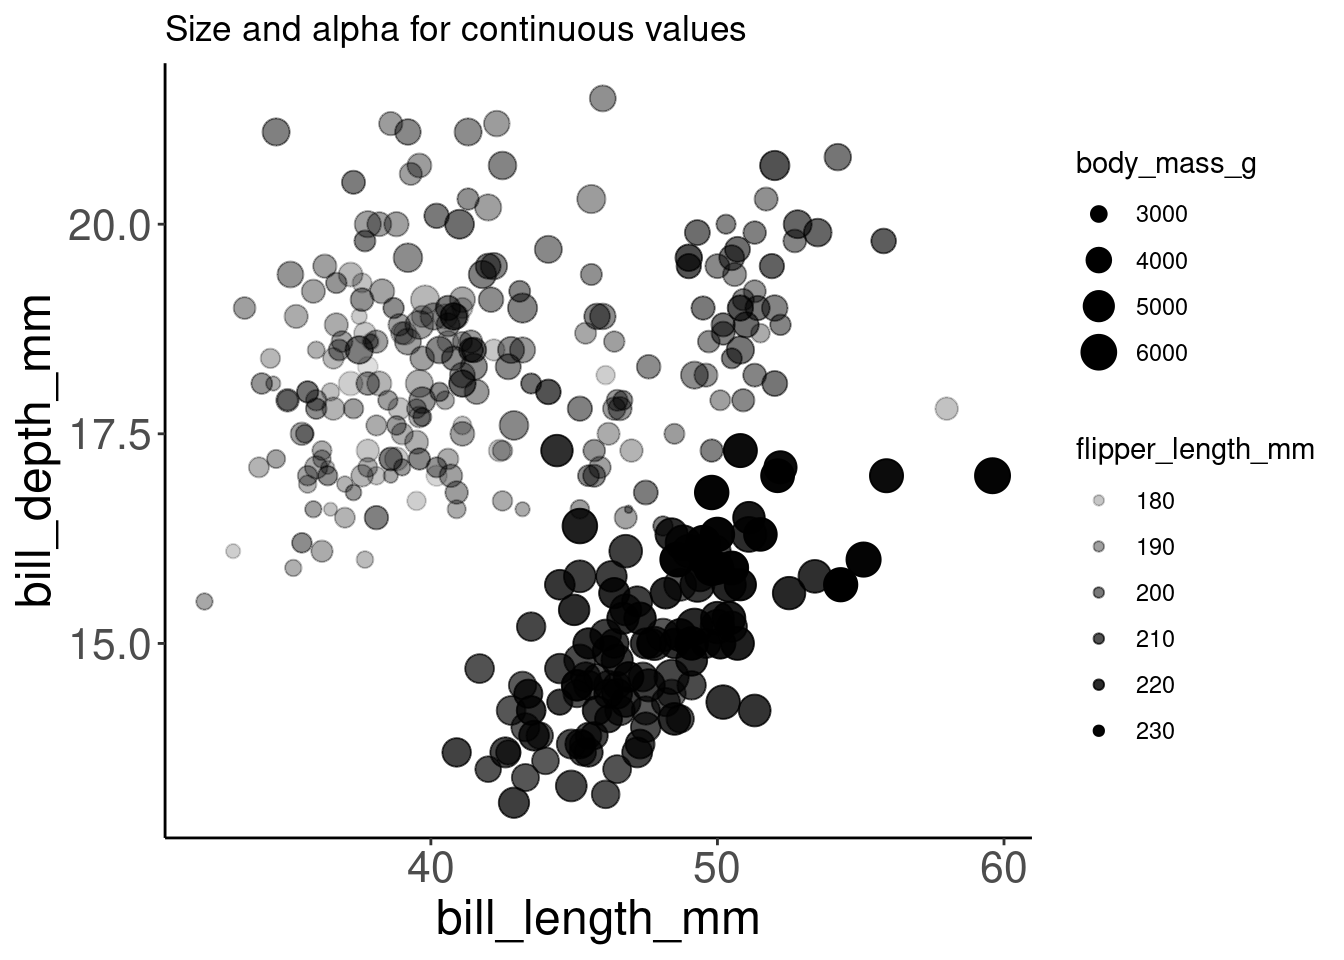
You may have noted in the second plot that you can even combine multiple of these options at once! But, setting many variables to visual cues like color, shape, size, and alpha at once tends to be overwhelming for the viewer. Adding 4 levels of complexity on top of the 2-dimensional representation of points can be too much to process properly. It is preferable to choose the visual cues and key variables for the desired message than to overload a plot with every possibility in the aes() function.
9.1 Challenge 2
Produce an informative plot from built-in datasets such as
mtcars,CO2ormsleep.Use appropriate aesthetic mappings for different data types!
| Data | x | y | Aesthetics |
|---|---|---|---|
| mtcars | wt | mpg | disp and hp |
| CO2 | conc | uptake | Treatment and Type |
| msleep | log10(bodywt) | awake | vore and conservation |
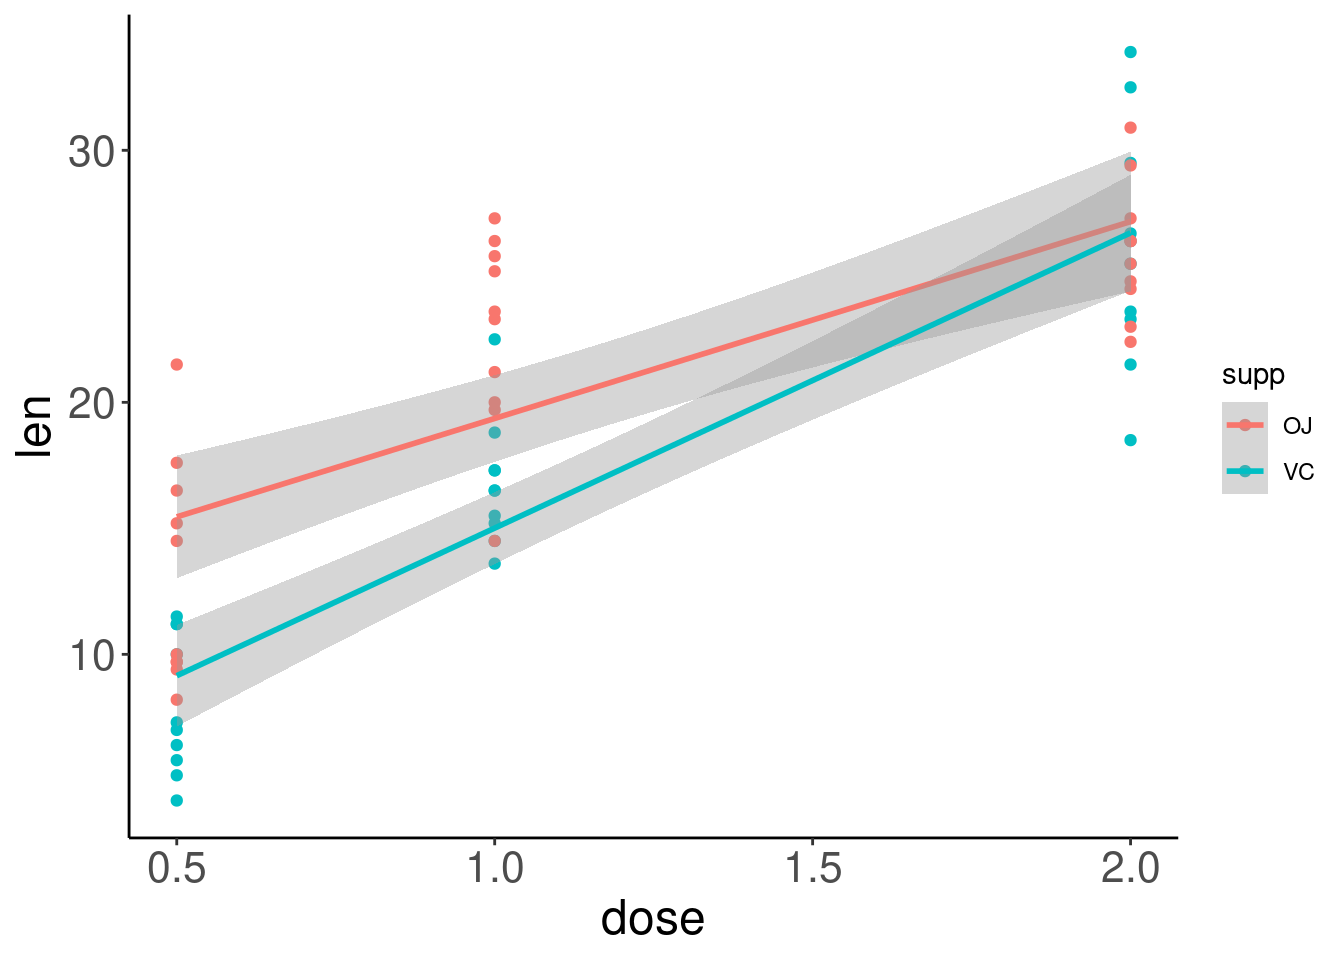
| ToothGrowth | dose | len | supp |
Pay attention to the data types!
9.1.1 Challenge 2: Solution (mtcars)
There are multiple ways to respond to this challenge. Here is one example using the mtcars dataset:
| Data | x | y | Aesthetics |
|---|---|---|---|
| mtcars | wt | mpg | disp and hp |
# One of many solutions: mtcars
data(mtcars)
ggplot(data = mtcars) + geom_point(aes(x = wt, y = mpg, colour = disp,
    alpha = hp))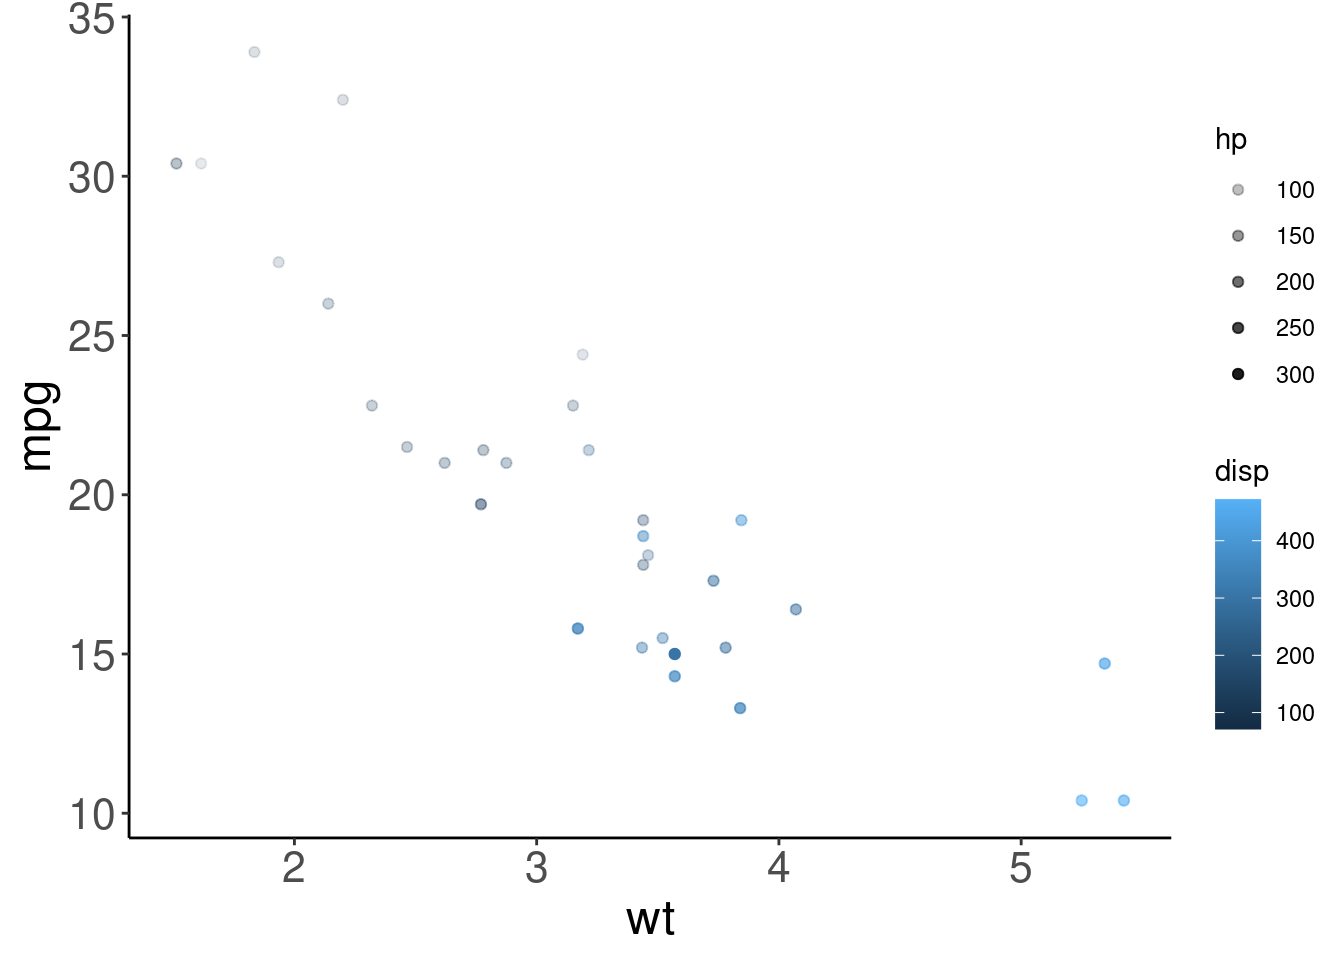
Could you use size instead of alpha? What about shape?
9.1.2 Challenge 2: Solution (CO2)
Here is a second example using the CO2 dataset:
| Data | x | y | Aesthetics |
|---|---|---|---|
| CO2 | conc | uptake | Treatment and Type |
# Another possible solution
data(CO2)
ggplot(data = CO2) + geom_point(aes(x = conc, y = uptake, colour = Treatment,
    shape = Type))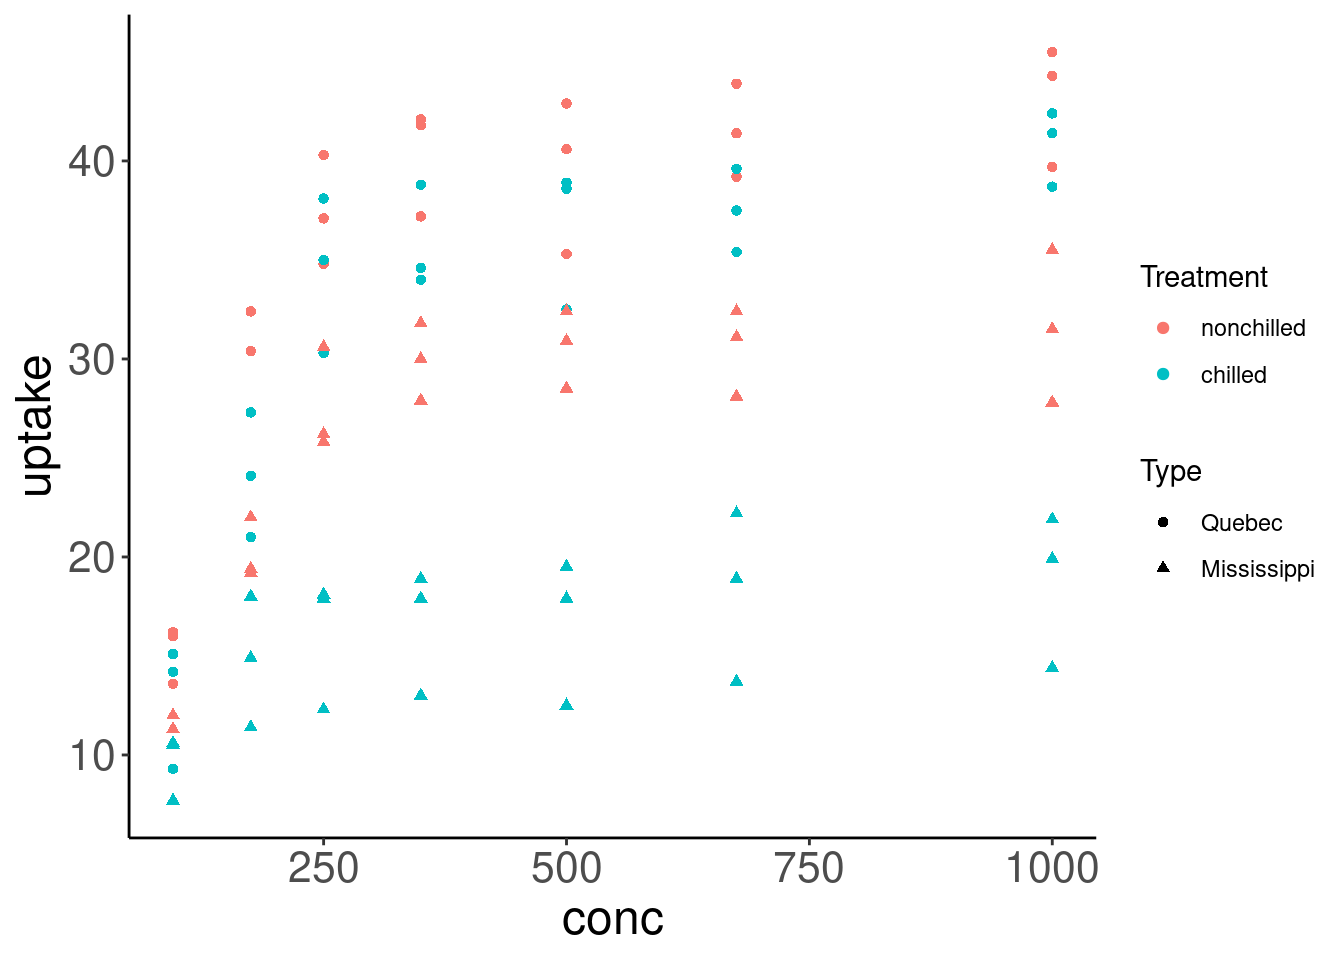
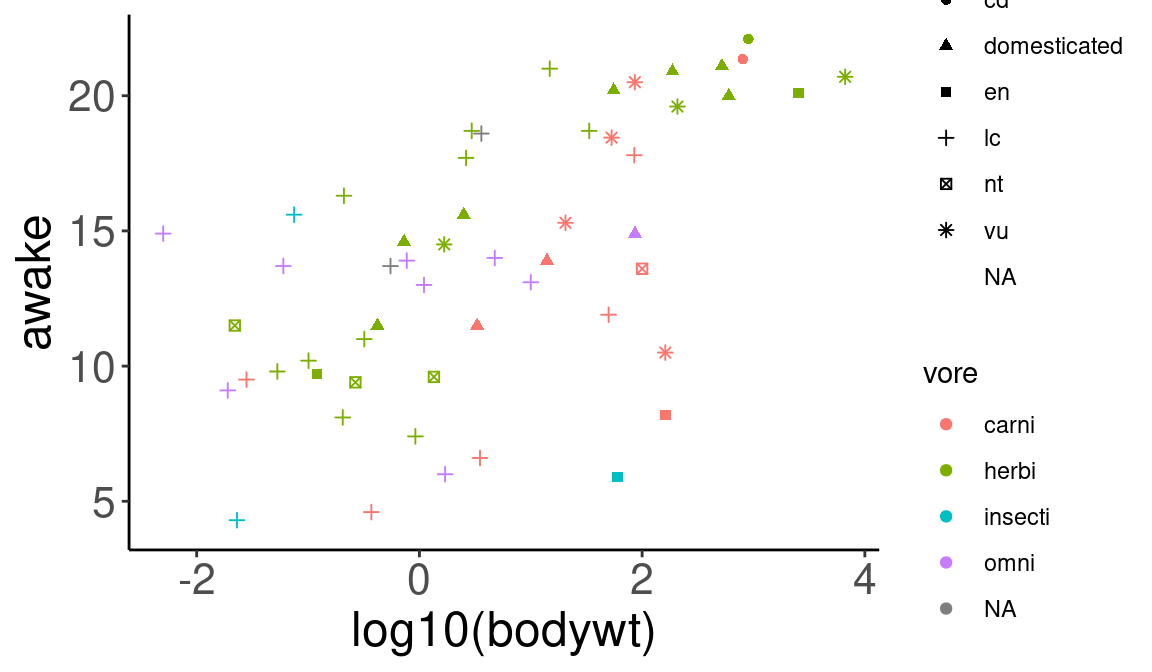
9.1.3 Challenge 2: Solution (msleep)
Here is a third example using the msleep dataset:
| Data | x | y | Aesthetics |
|---|---|---|---|
| msleep | log10(bodywt) | awake | vore and conservation |
# Another possible solution
data(msleep)
ggplot(data = msleep) + geom_point(aes(x = log10(bodywt), y = awake,
    colour = vore, shape = conservation))