Chapter 7 Aesthetics
Let’s talk more about the aesthetic layer, this is where we can get really creative with our data! We can use aesthetics (aes()) to distinguish classes, groups and structure.
In this section, we will talk about colour, shape, size, labels and transparency so that you can make your plots look exactly how you imagined them.
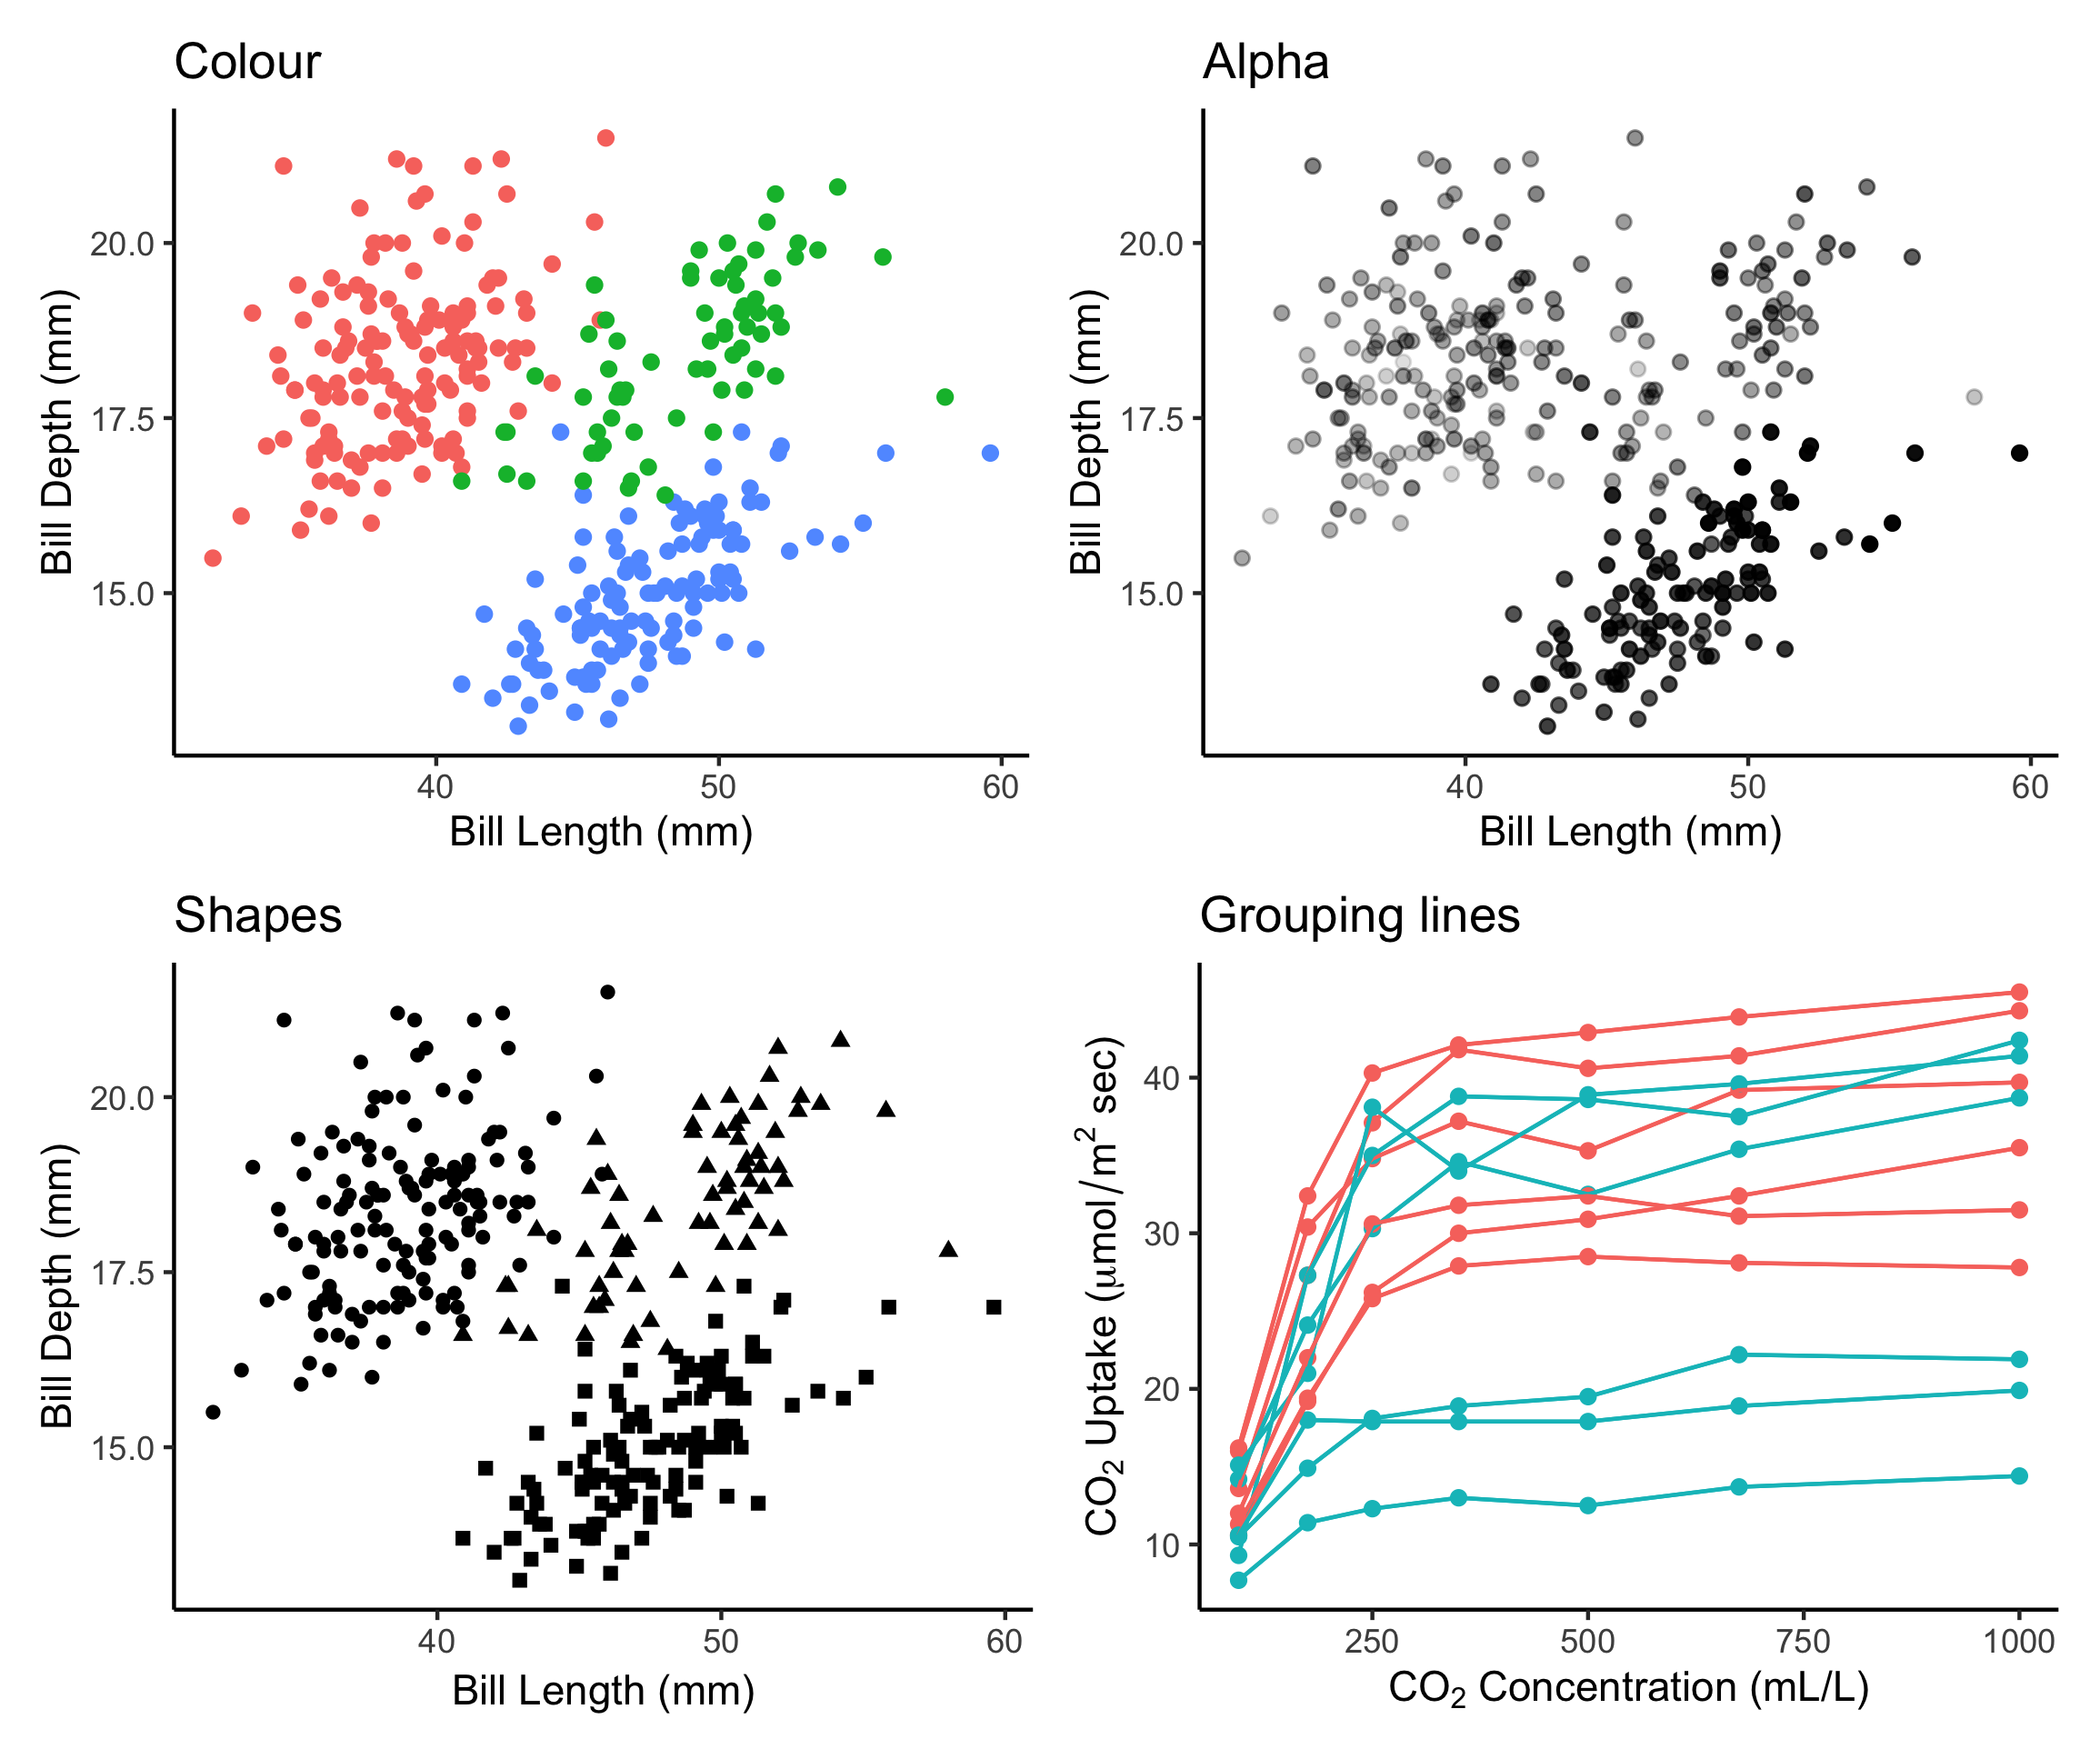
Figure 7.1: Aesthetics allow us to represent many dimensions of our dataset in one plot by varying colour, shape, size, labels and transparency.