Chapter 10 Changing the scale of the axes
We can also adjust the scale of our axes using the coord_trans() function.
Sometimes transforming our axes is necessary to show certain relationships within our data. A common example is a log transformation with log10().
Let us compare an example with an untransformed axes, followed by \(log_{10}\)-transformed axes.
Example A: x axis on the original (untransformed) scale
ggplot(diamonds) + geom_point(aes(x = carat, y = price)) + labs(title = "Original scale")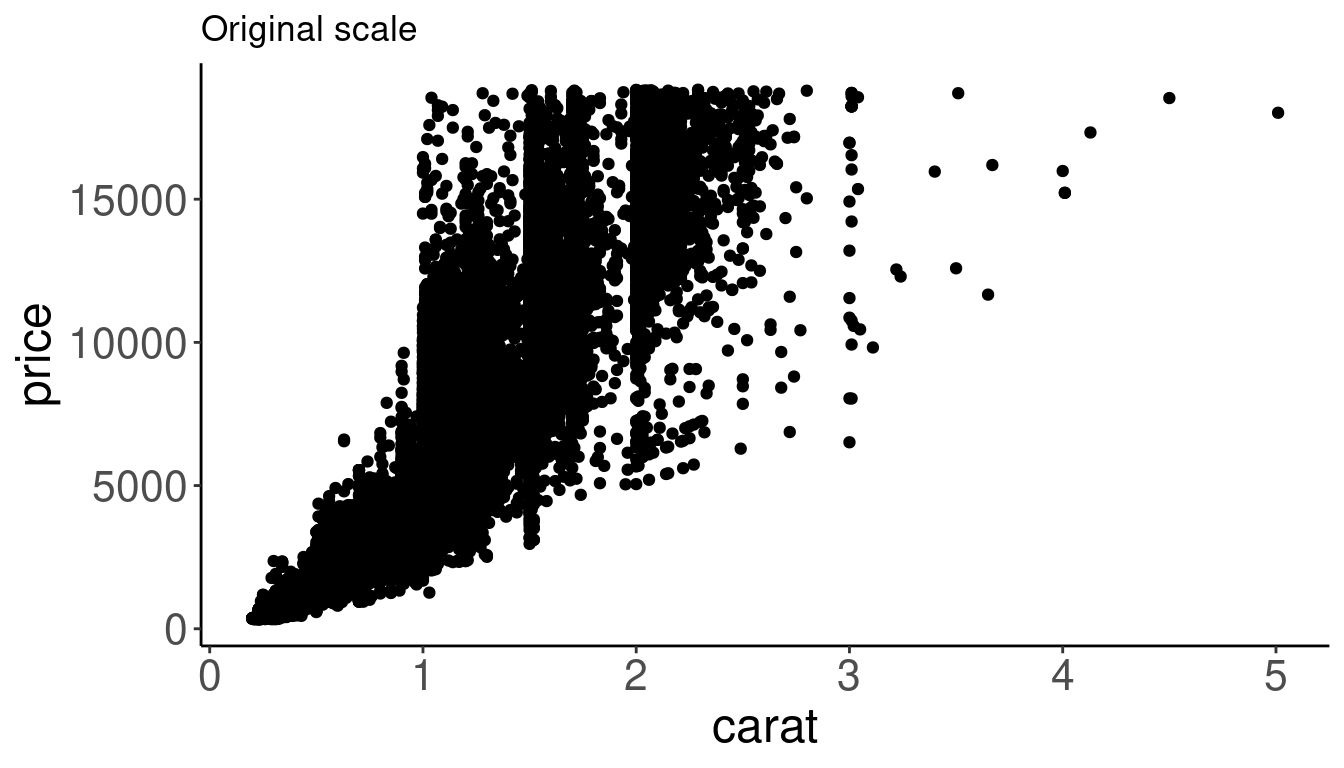
Example B: x-axis and y-axis in \(log_{10}\) scale
ggplot(diamonds) + geom_point(mapping = aes(x = carat, y = price)) +
    coord_trans(x = "log10", y = "log10") + labs(title = "log10 scale")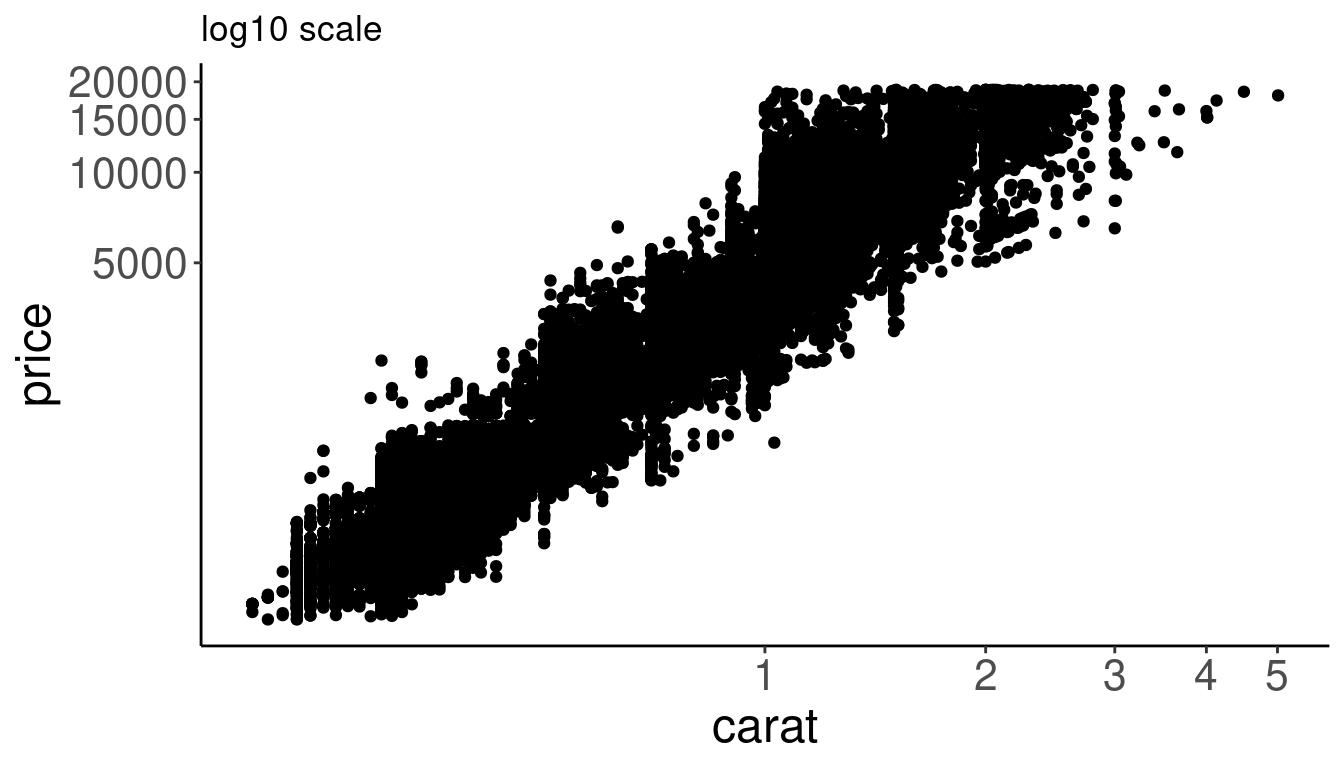
It is also possible to transform the coordinate system using scale_x_log10() and scale_y_log10().