Chapter 14 Arrange plots: patchwork
So far, we have used facets to split our plot into multiple windows. However, this is restricted to plotting the same variables from the same dataset.
The patchwork package makes it easy to arrange separate ggplots together in one frame with + (arrange plots beside each other), / (arrange one plot on top of the other), () (group this arrangement of plots) as though you are writing an equation.
# load patchwork to arrange our density plots
library(patchwork)

# adding them together means 'place them beside each other'
peng.dens + cars.dens + plot_annotation(tag_levels = "a")  # adds a) and b) to your plots, to reference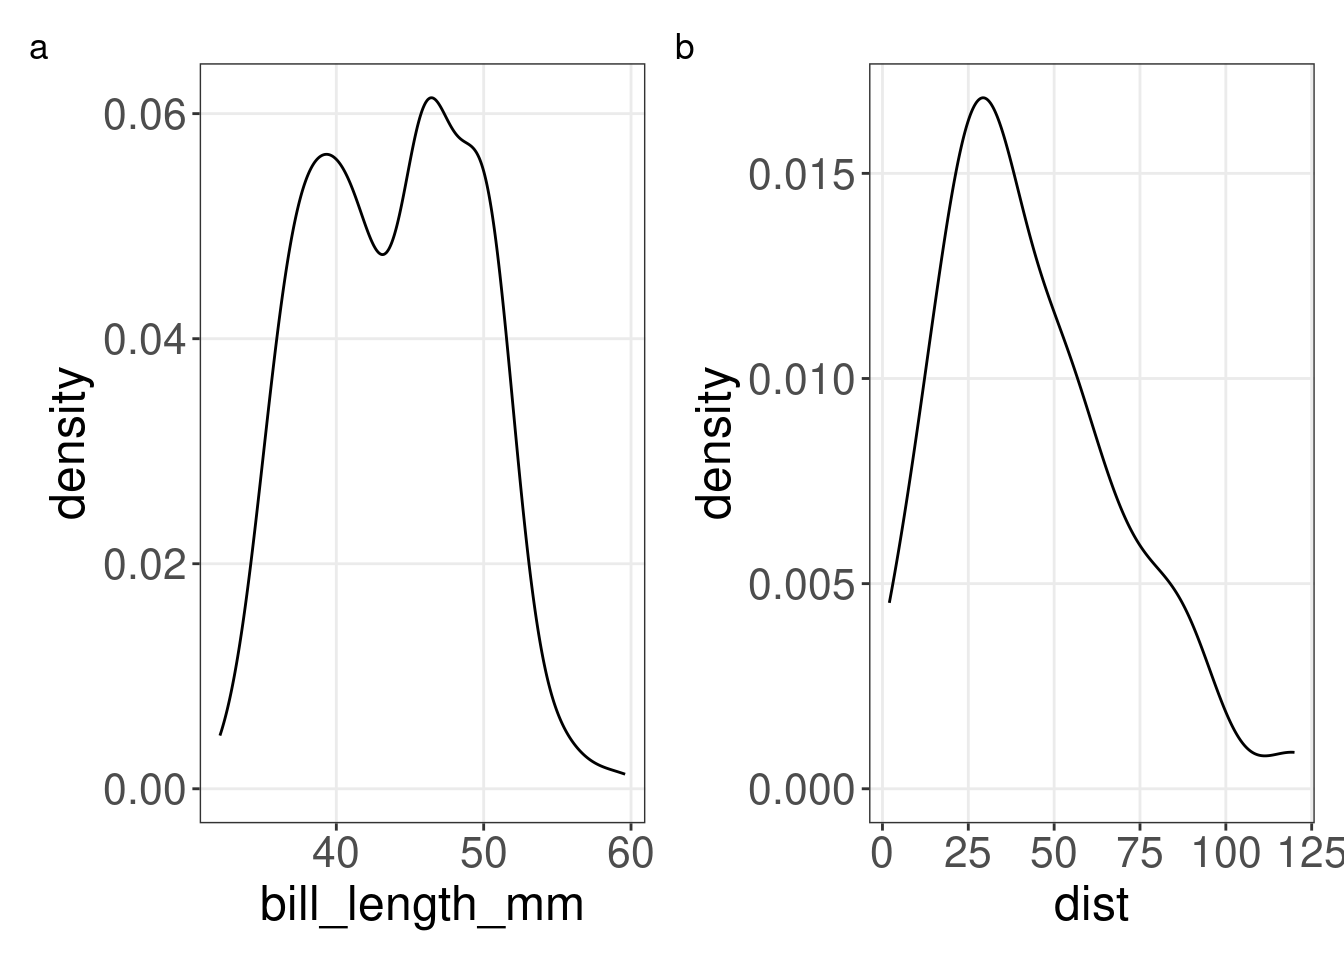
# in your figure captions.