Chapter 5 Analyzing the data
We know that ecological and biological data are often complex. Many datasets will include:
- Hierarchical structure in the data
- Many covariates and grouping factors
- Unbalanced study/experimental design
So how can we analyze our data?
- Option 1: Separate - Run separate analyses for each species in each lake
- Option 2: Lump - Run one analysis ignoring lake and species
- Option 3: ?
Let’s look a little closer at these options using our fish dataset!
5.1 Option 1: Separate
One way to analyze this data is to fit linear regressions for each species in each lake.
What would it look like it we ran separate analyses for each species?
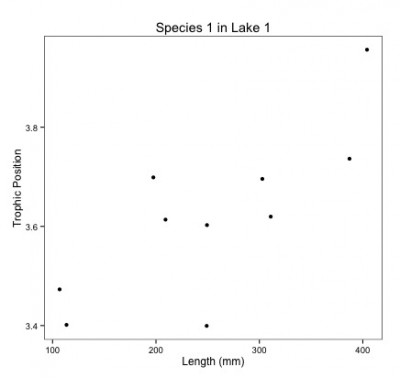
Notice you would have to estimate a slope and intercept parameter for each regression (2 parameters x 3 species X 6 lakes = 36 parameter estimates) and the sample size for each analysis would be 10.
There is a decreased chance of finding an effect due to low sample size and increased familywise error rate due to multiple comparisons.
5.2 Option 2: Lump everything together
Another way to analyze this data is to fit a single linear regression ignoring species and lake.
What would it look like it we put all of our data together for all lakes?
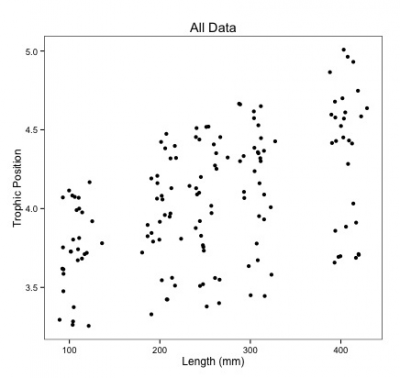
Notice you now have a huge sample size and far fewer parameters to estimate!
But what about pseudoreplication? Fish within a lake and within a species might be correlated.
Also, look at all that noise in the data, some of it might be due to differences among species and lakes.
5.3 Option 3: Is there a third option?
For our question, we only want to know if there is a general effect of body length on the trophic position.
However, this relationship might differ slightly among species due to unmeasured biological processes (e.g. growth rate) or among lakes due to unmeasured environmental variables. But we are not interested in this variation, so we need to find a way to control these potential effects while still maximizing the use of our data. This is why both separating and lumping alone are unsatisfactory options.
This brings us to mixed models! Linear mixed models enable us to lump and separate the analysis.
Linear mixed models:
- estimate slope and intercept parameters for each species and lake (separating), but estimate fewer parameters than classical regression;
- use all the data available (lumping) while accounting for pseudoreplication by controlling differences among lakes and species.
In doing so, they:
- allow you to use all the data you have instead of using means of non-independent sample;
- account for structure in your data (for example, quadrates nested in sites nested in forests);
- allow relationships to vary by different grouping factors (also known as random effects);
- require less parameter estimates than classical regression which saves you degrees of freedom.
But how do they do all of this? Let’s get into it!