Section 9 Developing
9.1 Guidelines
This guide is designed to aid developers during the creation and modification of workshop content. We want to ensure attendees can focus on the content being presented without being distracted by issues of style, grammar, punctuation and/or structure.
Please read through this guide carefully before starting, and refer back to it regularly as you work.
9.1.1 Main priorities
Here we have compiled a list of priorities for workshop developers. Ideally, all of these tasks would be accomplished in the alloted timeframe. However, if circumstances make this impossible, it is important to focus on structural changes before issues of style. Please note that these tasks are to be shared amongst developers for each workshop.
A checklist version of this list has now been opened as an issue within the GitHub repository for each respective workshop. We suggest using these checklists as a way of tracking your progress while working and coordinating with your fellow developer, if applicable. It can also be used as a reference for reporting the work completed to the QCBS R Workshop Series coordinators, or requesting additional hours.
General priorities:
Address existing issues submitted to GitHub. In addition to the checklist of common tasks developers are responsible for, we have opened workshop-specific issues here that we hope can help inform developer workflow. For an example, see Workshop 1 issues.
Ensure code is working correctly and that code matches workshop presentation. Continue to check this as you make changes.
Ensure that French and English versions of a workshop are both updated and that the content is equivalent.
Workshops should not contain spelling, grammar or punctuation errors.
Ensure workshop slides are written in a consistent style, this helps with the flow of workshops and student understanding. This is especially important when working collaboratively with other developers.
Whenever possible, include presenter notes to the slides you modify. You can write notes for yourself to read in the presenter mode (press the keyboard shortcut
p). These notes are written under three question marks???. See the example below:
---
The content of this workshop is essential for your graduate life.

???

Note: _The presenter should sing this slide to the participants_.
---
9.1.2 Structural rules
Do not allow the content of slides to overflow the screen.
The code used to generate an outcome (figure or calculation) must correspond to the code being displayed.
Use back ticks
`whenever you mention a function, an object or a package in your prose.Use three back ticks
```to separate code chunks from prose.Pay attention to fluidity and distractions.
Use all resources that can be help you provide a visually pleasing presentation, such as:
Do not modify the directory names;
Do not add unnecessary files to the root directory: data go within the
datadirectory; images go within theimagesdirectory;
For specific instructions on special formatting, look into the book template and the presentation template.
9.1.3 Grammar and style
Pay attention to punctuation, spelling, and grammar.
Avoid unnecessary abbreviations (e.g. use do not instead of don’t).
Strive to be clear and concise. Avoid run-on sentences.
Read over the workshop in its entirety to ensure there is good flow.
Do not hesitate to ask your developing peer to review your writing.
9.2 Active learning
Workshops should go beyond a lecture-based perspective and should include activities that promote active learning amongst participants. Below, we provide a few examples of exercises elaborated from evidence-based learning modes and effective strategies to deliver remote workshops to participants.
We recommend that you take your time and plan well when elaborating exercises. Keep the exercise goals aligned with the objectives of the workshop.
Remember that everything written below
???are notes for the presenter and thus will not appear in the presentation slide, but will appear within the presentation window.
9.2.1 Simple polls
See below a couple of examples of two slides containing an exercise followed by their solutions.
Example 1
Context: Workshop participants have just learned which functions to use to perform comparisons between dependent and independent groups, and have also been introduced to the one- and two-tailed hypothesis testing.
Goal: Evaluate participant knowledge and make them more confident when selecting the appropriate two-samples test in their research.
Elaborated by: Pedro Henrique P. Braga
---
We are interested assessing whether we find more acromantulas in forested and shaded areas in relation to open areas. We went to the field and counted the number of individuals (variable: `abundance`) in ten randomly distributed forested and open landscapes (variable: `type_of_area`). Which of the following functions would be appropriate to test our hypothesis?

1. `t.test(type_of_area, abundance, data = acromantula_experiment, alternative = "two.sided")`;
2. `t.test(type_of_area, abundance, data = acromantula_experiment, paired = TRUE, alternative = "two.sided")`;
3. `t.test(type_of_area, abundance, data = acromantula_experiment, alternative = "one.sided")`;

???
Note: During this moment, a poll should be opened to participants. Once you obtain the response from participants, show them the correct answer. You may request that one of the participants to explain their answer.

---
We are interested assessing whether we find more acromantulas in forested and shaded areas in relation to open areas. We went to the field and counted the number of individuals (variable: `abundance`) in ten randomly distributed forested and open landscapes (variable: `type_of_area`). Which of the following functions would be appropriate to test our hypothesis?

1. `t.test(type_of_area, abundance, data = acromantula_experiment, alternative = "two.sided")`;
2. `t.test(type_of_area, abundance, data = acromantula_experiment, paired = TRUE, alternative = "two.sided")`;
3. `t.test(type_of_area, abundance, data = acromantula_experiment, alternative = "one.sided")  #<<`;

???
Note: You should clarify to the participants the distinction between two-sided and one-sided hypothesis testing (in the context of the problem). In addition to that, you should also recall the differences between dependent and independent measures (related to the `paired` argument).
---
Example 2
Context: Participants have been introduced to generalized linear models, and have just learned about the Poisson distribution, about its assumptions that variance is equal to the mean, and how overdispersion in their data can be an issue when fitting these models. They have been introduced to the quasi-Poisson family and to the possibility of applying an overdispersion correction for binary data with the quasibinomial family object.
Goal: Assess the participant’s ability to apply the concept of overdispersion correction to different types of data, to help them better understand the relationship between the family objects and the link functions, and to reinforce the idea that models can be updated without having to create new ones.
Elaborated by: Esteban Góngora
---
We now realized that the proportion example for infected deer may have issues with overdispersion (variance increases much faster than the mean). Which of the following functions would be an appropriate update to account for overdispersion in our proportion data?

1. `prop.reg.quasi <- glm(prop.infected ~ res.avail, family = quasipoisson(link = “logit”), weights = n.total)`;
2. `prop.reg.quasi <- glm(prop.infected ~ res.avail, family = quasibinomial, weights = n.total)`;
3.`prop.reg.quasi <- update(prop.reg2, family=quasibinomial(link = “logit”))`;

???
Note: During this moment, a poll should be opened to participants. Once you obtain the response from participants, show them the correct answer. You may request that one of the participants to explain their answer.

---
We now realized that the proportion example for infected deer may have issues with overdispersion (variance increases much faster than the mean). Which of the following functions would be an appropriate update to account for overdispersion in our proportion data?


1. `prop.reg.quasi <- glm(prop.infected ~ res.avail, family = quasipoisson(link = “logit”), weights = n.total)`;
2. `prop.reg.quasi <- glm(prop.infected ~ res.avail, family = quasibinomial, weights = n.total)`;
3. `prop.reg.quasi <- update(prop.reg2, family=quasibinomial(link = “logit”))  #<<`;

???
Note: You can now explain to the participants that we can obtain the corrected model with options 2 and 3. However, option 3 is the correct choice as you had requested the participants to update the `prop.reg2` model. You can also remind the participants that each distribution has a default link function so using `family = quasibinomial` and `family=quasibinomial(link = “logit”)` will produce the same outcome as `logit` is the default link function for the quasibinomial distribution.
---
9.2.2 Group exercise
Working in small groups leverages the strengths of the individual group members and improves the success of the collective setting. This exercise requires participants to be randomly assigned to breakout rooms (ideally, 5 participants per breakout room) and should include an activity referring to a point of discussion. At the end of this exercise, the workshop is reconvened and one of the participants from each breakout room should report and summarise the discussion. This activity should last around 10 minute (sometimes less if very simple) and it should use information that has been provided to the students during the workshop.
See below two examples of slides containing an exercise followed by its solution:
Example 1
Context: This exercise should be provided to set the ground for discussions during a data visualization workshop. It does not require a strong knowledge background in data visualization from participants.
Goal: Foster participants critical thinking on data visualization.
Elaborated by: Pedro Henrique P. Braga
---
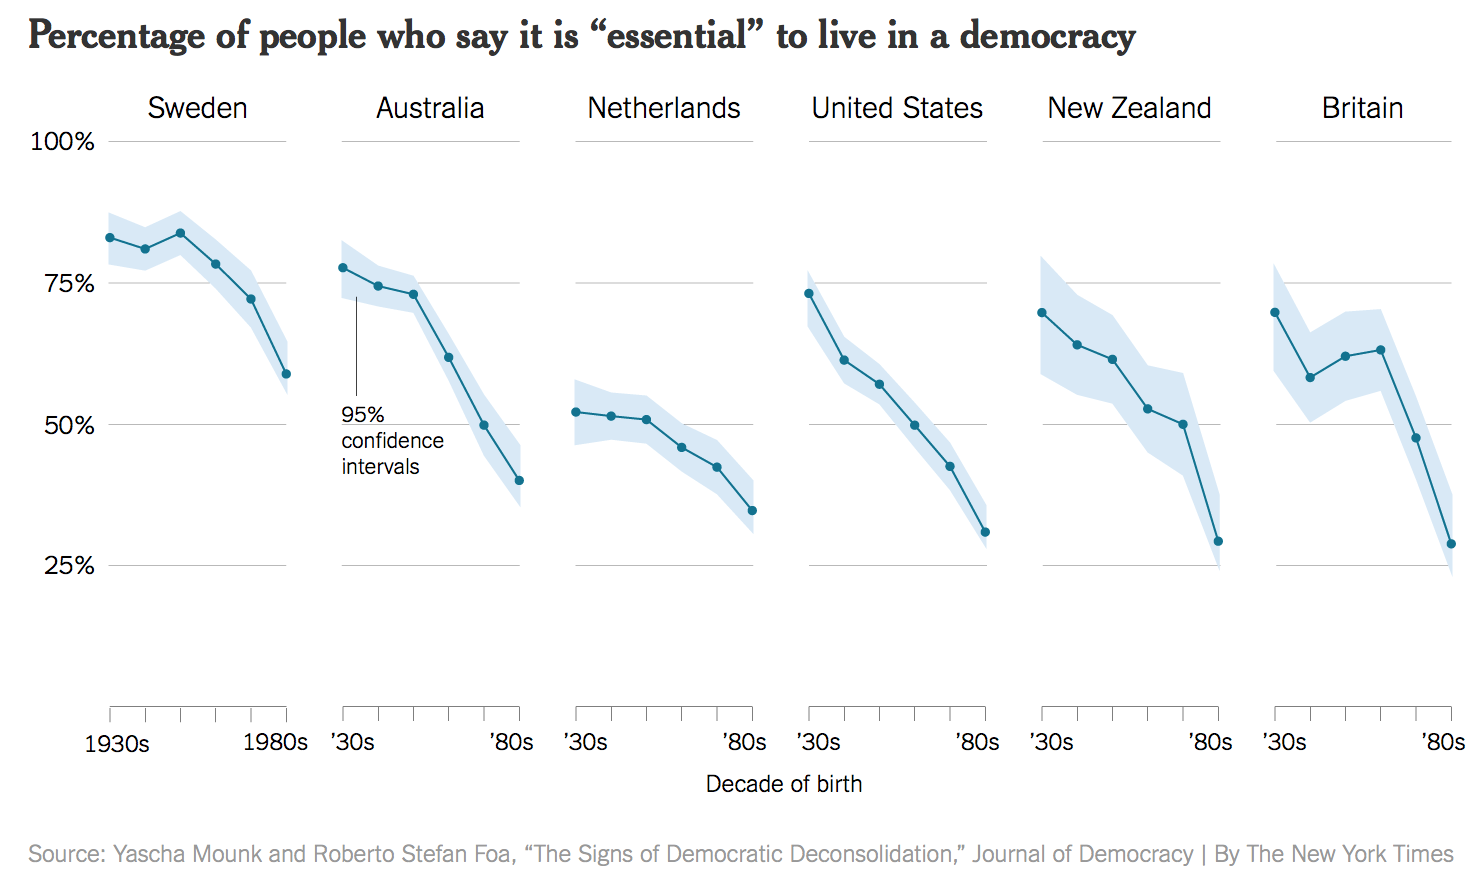
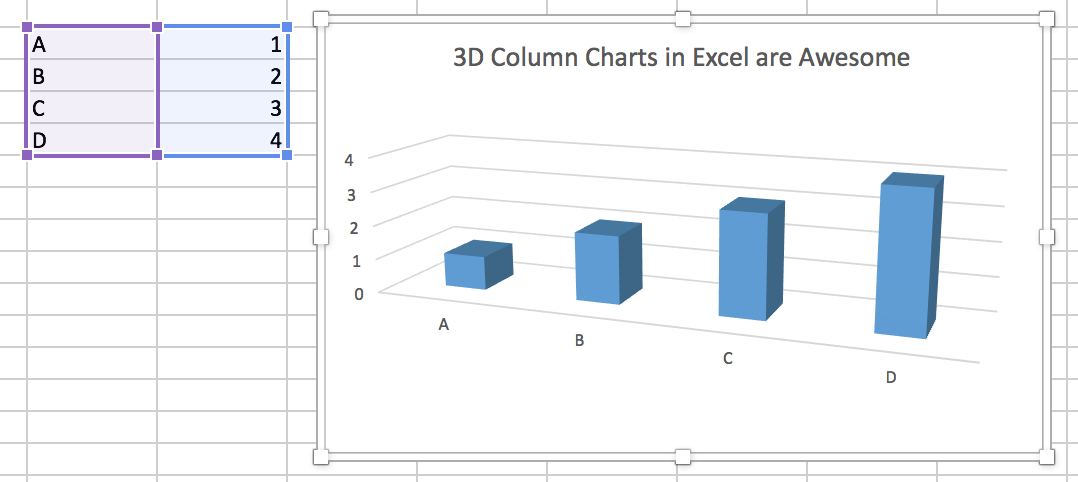
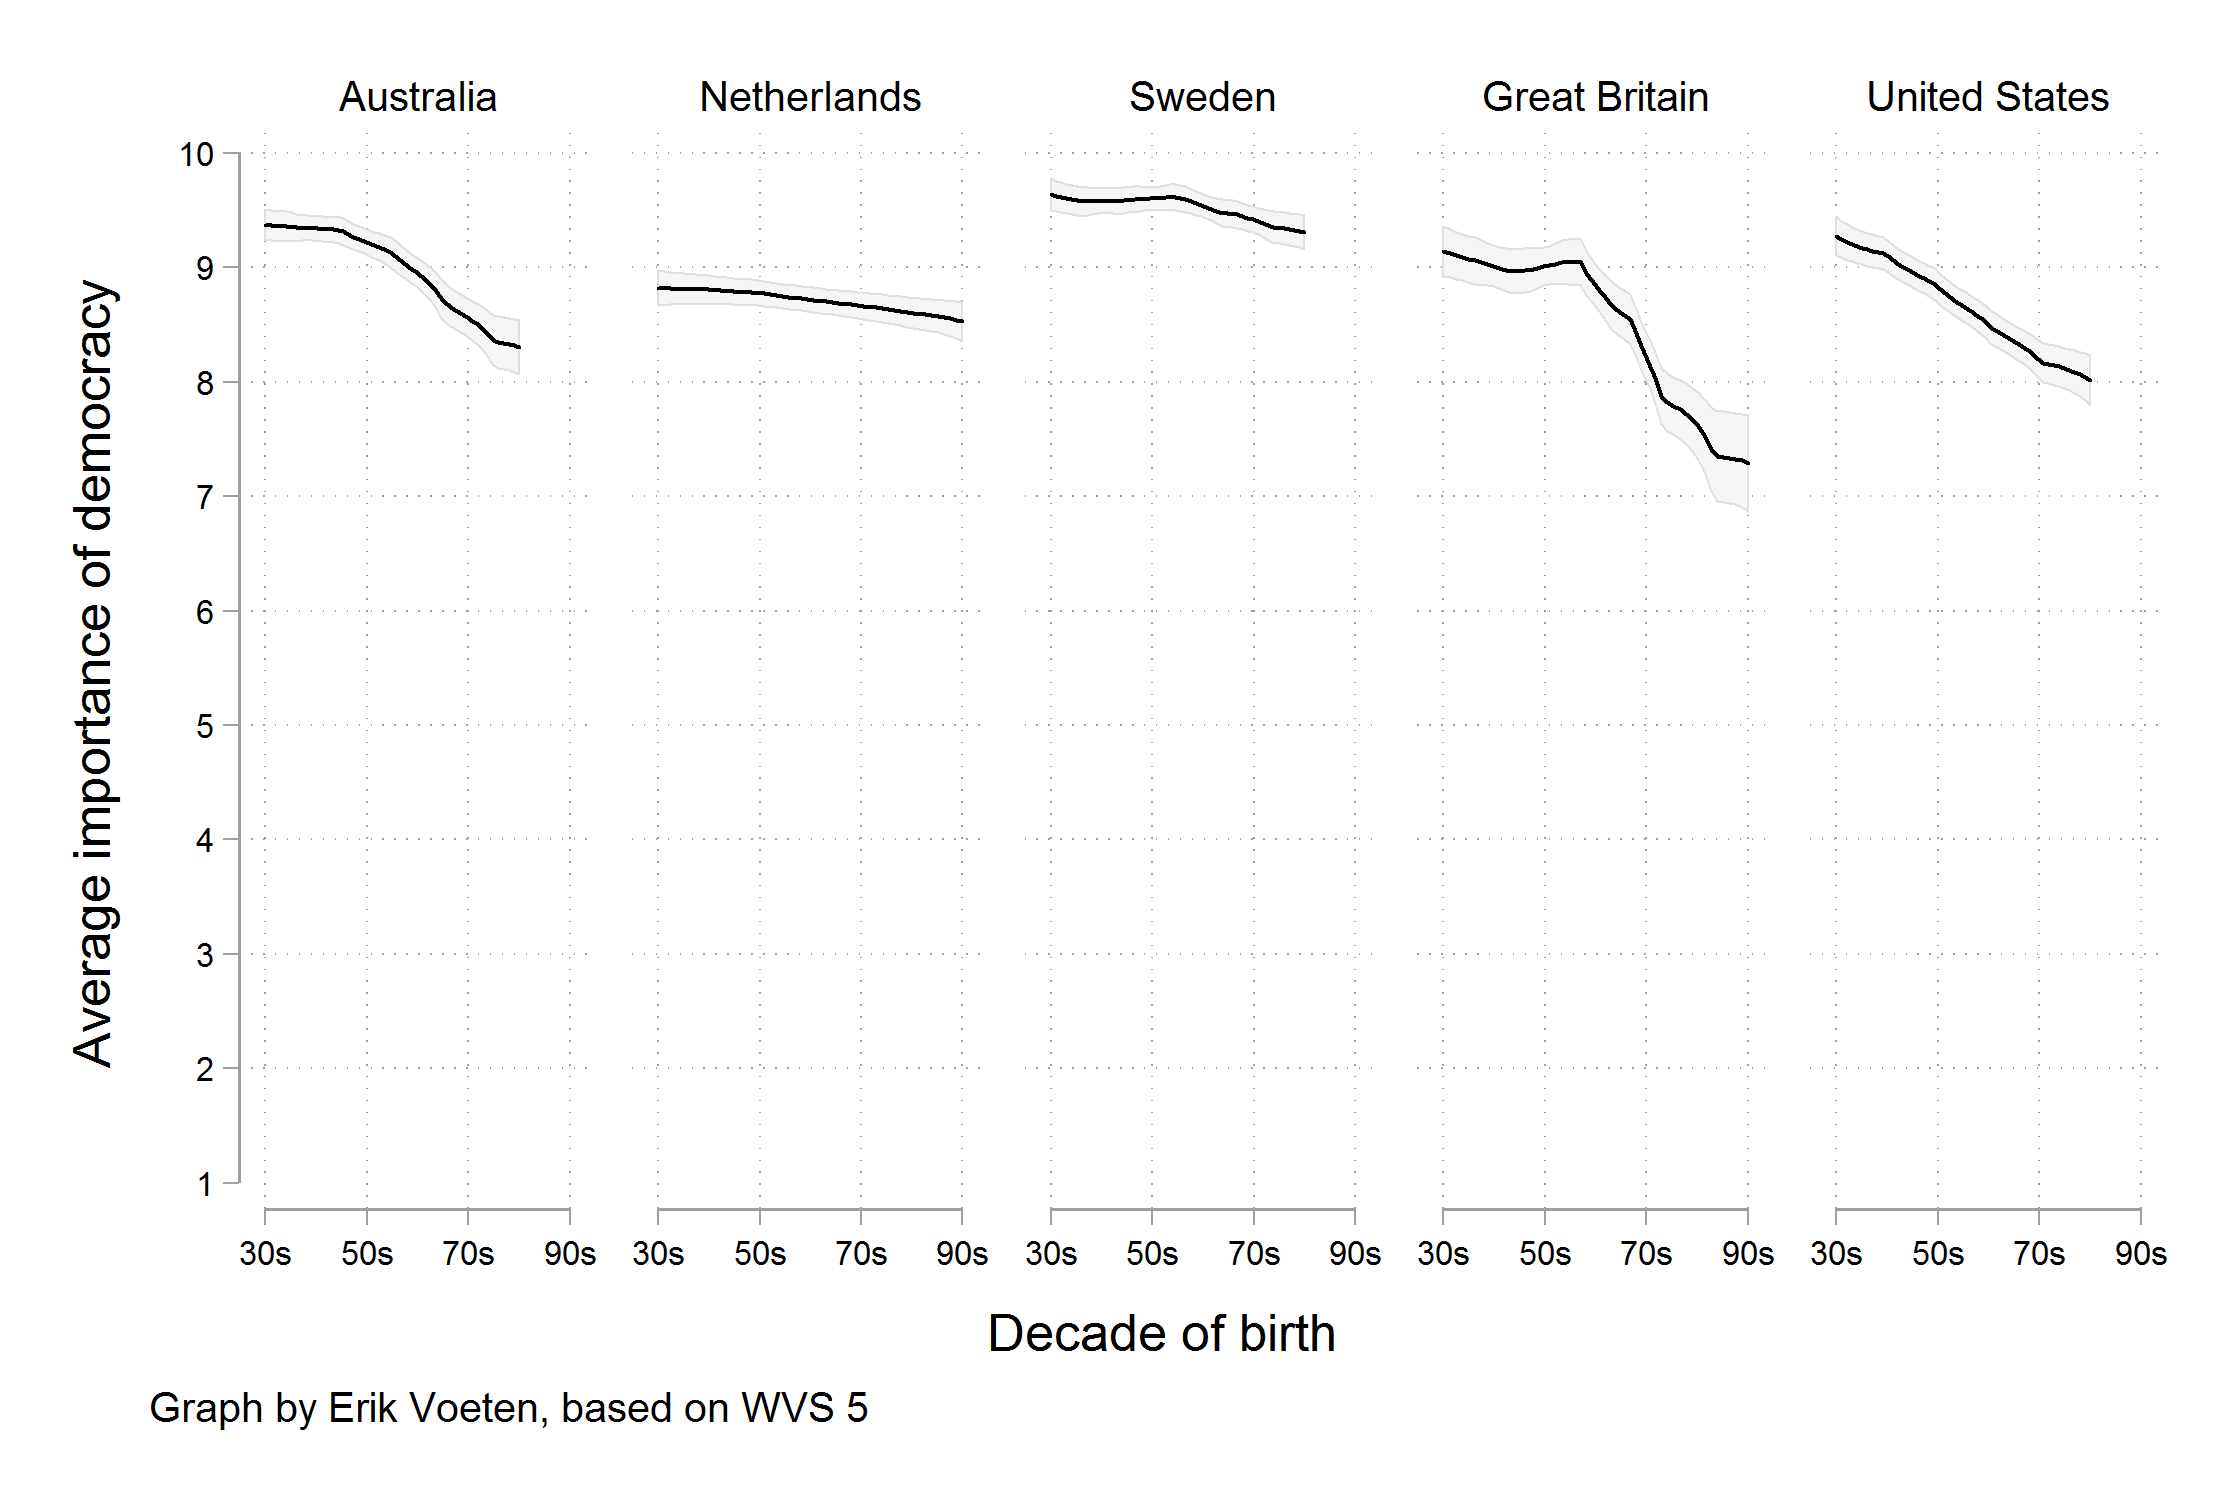
Group discussion: Below there are three charts compiled from a visualization book (reference shown in the next slide). Open and observe the charts and discuss with your group to respond the following questions:
(a) What problems do you see in each one of the charts?
(b) What are the consequences of these problems you have identified?
(c) What would you change in each one of them to improve their information?
### Add these images side by side.


???
Note: Clearly read the exercise to the participants and show them the figures. Tell them that they should summarise their answers and then one person should report back to the discussion when the class is convened. You may allow 5 to 8 minutes for the discussion in the breakout rooms (depending on group size) as this is is a very simple example.
---
Group discussion: Below there are three charts compiled from a (visualization book)[https://socviz.co/lookatdata.html]. Open and observe the charts and discuss with your group to respond the following questions:
(a) What problems do you see in each one of the charts?
(b) What are the consequences of these problems you have identified?
(c) What would you change in each one of them to improve their information?
### Show images side-by-side

???
Note: The figures in question are not only a matter of bad taste, but have issues related to the way they convey information. In this example, the issue is not due to a difference in how the y-axis is drawn. Rather, a different measure is being shown: we are now looking at the trend in the average score, rather than the trend for the highest possible answer.
---Example 2
Context: Participants have just been introduced to multivariate analyses, and have just seen the summary table showing the main characteristics of unconstrained ordinations.
Goal: Allow participants to critically apply the presented information in this workshop by determining which type of study/data would best fit the different types of ordinations.
Elaborated by: Esteban Góngora
---
Group discussion: Each group will be randomly assigned a type of ordination. You will discuss among your group which possible types of datasets would best fit the type of ordination you were assigned. Each group will present a concrete example of an project/study/experiment that would be used with their ordination method.
### Include the summary table for reference.

???
Note: Clearly read the exercise to the participants and assign each breakout room a type of ordination. Tell them that they should use the characteristics from the summary table to come up with the response and then one person should report back to the discussion when the class is convened by presenting the chosen example and briefly mention the reason why they chose it. You may allow 5 to 8 minutes for the discussion in the breakout rooms (depending on group size). While the participants are discussing in their breakout rooms, think of possible examples you could give the participants in case the discussion doesn't flow as expected (remember this is the end of the workshop so people might already be tired).
---
Group discussion: Each group will be randomly assigned a type of ordination. You will discuss among your group which possible types of datasets would best fit the type of ordination you were assigned. Each group will present a concrete example of an project/study/experiment that would be used with their ordination method.
### Include the summary table for reference.

???
Note: Mention a few examples or use the exercises presented during the workshop to wrap up the discussion.
---9.2.3 Individual exercise
Simple individual exercises require participants to practice a bit on their own. Depending on how difficult the exercises may be, consider allocating between 5 and 10 minutes for their execution.
While these exercises help participants assimilate the content, some attendees may be less driven to practice and execute them (in contrary to the group exercises). Because of this, consider include other types of exercises in addition to these ones.
At the end of these exercises, the presenter should give the opportunity for one or a few participants to present and discuss their responses.
Below, we can see an example for an independent exercise and its solution:
Context: Participants have just been introduced to the distribution families, link functions and they have seen examples of how the glm() and manyglm() function work.
Goal: Encourage participants to always observe diagnostic plots when choosing between models.
Elaborated by: Pedro Henrique P. Braga
---
Use `manyglm()` to estimate the responses of mite community composition to all environmental variables associated with the `mite` dataset. Which error families (gaussian, poisson or negative binomial) best fit the data?

Do not forget to load the `vegan` and `mvabund` libraries, and use `data(mite)` and `data(mite.env)` to load the datasets.

Tip: Remember what we have discussed about model assumptions!

???
Note: The objective of this exercise is to allow participants to independently write the models, to assign the appropriate arguments related to the distribution families and to realize they should plot the residuals against fitted values to decide on the best model. The instructor can remind participants about what both datasets include. The instructor or the assistant may help participants realize which arguments they can use by suggesting them to use the help `?` function. At the end of this exercise, invite participants to share their response and ask them how they have obtained it.

---
Use `manyglm()` to estimate the responses of mite community composition to all environmental variables associated with the `mite` dataset. Which error families (gaussian, poisson or negative binomial) best fit the data?

Solution:

### To be displayed inside a chunk code block:

mitedat <- mvabund(mite)

mite.gaussian.glm <- manyglm(mitedat ~ SubsDens + WatrCont + Substrate + Shrub + Topo, data = mite.env, family='gaussian')
mite.poisson.glm <- manyglm(mitedat ~ SubsDens + WatrCont + Substrate + Shrub + Topo, data = mite.env, family='poisson')
mite.nb.glm <- manyglm(mitedat ~ SubsDens + WatrCont + Substrate + Shrub + Topo, data = mite.env, family='negative.binomial')

# Display diagnostic plots side-by-side:
par(mfrow=c(1,3))
plot(mite.gaussian.glm)
plot(mite.poisson.glm)
plot(mite.nb.glm)

### End of code chunk

???

Note: Clearly show which arguments changed between the functions and what do they imply. Speak with the participants about how assumptions of distribution of residuals and predicted values still have to be met for the models to be considered valid.
---
9.3 How to develop workshops
This section guides you through the process of contributing edits to QCBS R workshop presentations.
9.3.1 Getting started
The QCBS R Workshops presentations are written in RMarkdown using a template built on xaringan. The first step is to install the R package xaringan.
Secondly, you need to create a local copy of the repository for the workshop you will be working on, found here. To do so, you can clone the GitHub repository on your computer.
You can use the command line to do this (more details here):
git clone https://github.com/QCBSRworkshops/workshop01.git
# change this link depending on the workshop you're working on!
If you are not comfortable with the command line, you can clone this repository using GitHub Desktop, following instructions here.
Once you have cloned the repository, you are ready to begin developing!
9.3.2 GitHub workflow
GitHub creates repositories with a single default branch, named dev (if you work in the command line) or main (if you work in GitHub Desktop). This is the branch you see when you visit the repository.
We strongly recommend working on a new branch, which allows you to develop the workshops without affecting the main branch in the repository. Working on a separate branch means that changes are only implemented in the original content once your contributions are reviewed. This is a “safer” way to develop the workshops, particularly when multiple people are collaborating on a workshop at the same time.
- Create and publish a new branch. Choose a name that is explicit about what you are adding, e.g.
workshop1_introif you are working on the introduction of workshop 1.
On the command line:
Github Desktop (instructions here).
- Switch to this branch. Make sure you are working on your new branch!
On the command line:
git checkout workshop1_intro # switches to this branch

# Note that you can create and switch branch in a single line:
git checkout -b workshop1_intro
GitHub Desktop (instructions here).
Make your changes, following the Guidelines listed above.
Add and commit your changes. Once you are finished making changes on your branch, add and commit them to record these changes. When you commit changes, it is essential to include a commit message that briefly summarizes what you’ve done. Keep it brief but informative!
On the command line:
git add -A # add all your changes
git commit -m "fix code for plot in Challenge 1" # commit your changes with a message
You can also use GitHub Desktop to add changes (instructions here) and commit them (instructions here).
- Sync your main branch with the remote repository. It’s important to make sure your main branch is up to date before changing it. Go to back to the main branch and pull changes that were made since you last copied the repository.
Pull the dev on the command line:
Pull the master branch on GitHub Desktop (instructions here).
- Merge your branch with the main branch locally. Switch back to your branch (e.g.
workshop1_intro) and merge it with your local main branch. If there are conflicts, please resolve them!
You can merge your branch with the dev branch using the command line:
git checkout workshop1_intro # switch back to your branch
git merge dev # merge the main branch with your branch
Merge your branch with the master branch in GitHub Desktop (instructions here).
- Push your locally merged branch to the remote GitHub repository.
On the command line, you can push your locally merged branch (e.g. workshop1_intro) to the remote repository like this:
Push your branch (e.g. workshop1_intro) to the remote repository in GitHub Desktop (see step #4)).
- Open a Pull Request.
Pull requests are a way to let your collaborators know about changes that you have pushed to a branch in the Github repository. Once you have opened a pull request, we can review potential changes and add follow-up commits (if needed) before your changes are merged into the main branch.
To open a pull request for your branch (e.g. workshop1_intro), please follow these instructions.
Assign your pull request to a reviewer (one of the R workshop coordinators). The reviewer will then review, squash, and merge your changes.
Once the pull request is merged, do not forget to pull the main branch!
A visual guide to the GitHub Workflow is also available here.
9.4 Other ways to contribute
If you are not comfortable with GitHub, you can still help us improve the workshops!
If you notice any mistakes or inconsistencies, or if you would like to make a suggestion, either in form or in content, you are invited to open an issue. You can follow these simple steps to create a new issue.