Chapter 22 Edit a plot using for and if
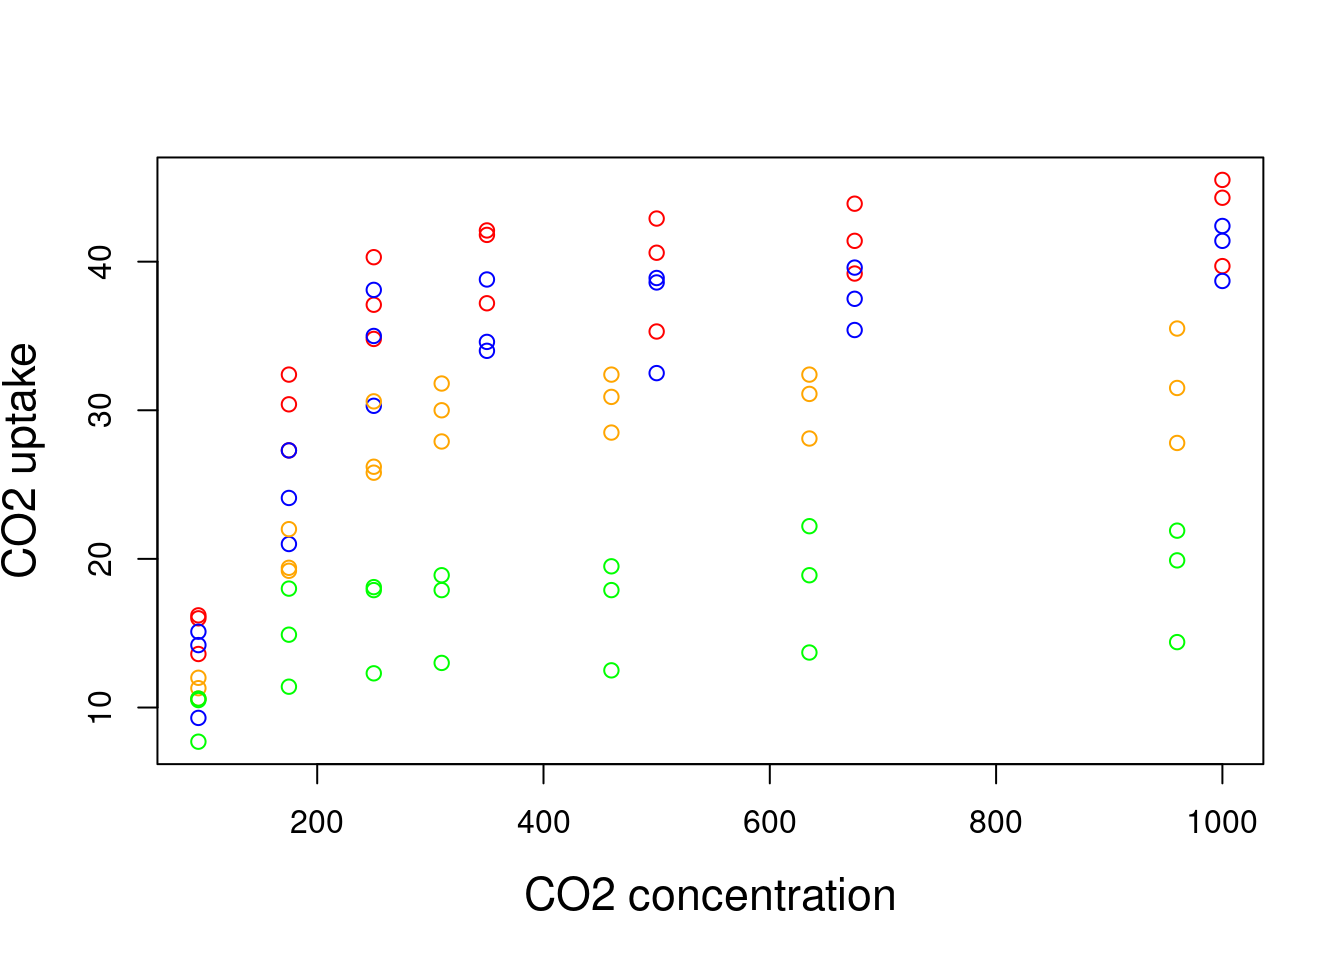
Let us plot uptake versus concentration with points of different colors according to their type (Québec or Mississippi) and treatment (chilled or nonchilled).
plot(x = CO2$conc, y = CO2$uptake, type = "n", cex.lab = 1.4,
    xlab = "CO2 concentration", ylab = "CO2 uptake")
# Type 'n' tells R to not actually plot the points.
for (i in 1:length(CO2[, 1])) {
    if (CO2$Type[i] == "Quebec" & CO2$Treatment[i] == "nonchilled") {
        points(CO2$conc[i], CO2$uptake[i], col = "red")
    }
    if (CO2$Type[i] == "Quebec" & CO2$Treatment[i] == "chilled") {
        points(CO2$conc[i], CO2$uptake[i], col = "blue")
    }
    if (CO2$Type[i] == "Mississippi" & CO2$Treatment[i] == "nonchilled") {
        points(CO2$conc[i], CO2$uptake[i], col = "orange")
    }
    if (CO2$Type[i] == "Mississippi" & CO2$Treatment[i] == "chilled") {
        points(CO2$conc[i], CO2$uptake[i], col = "green")
    }
}