Chapter 3 Recognizing and using R and RStudio
3.1 What is R?
- R is an open source programming language and environment.
- It is designed for data analysis, graphical display and data simulations.
- It is one of the world’s leading statistical programming environments.
3.2 Why use R?
- R is open-source! This means that it is free, and constantly being updated and improved.
- It is compatible. R works on most existing operating systems.
- R can help you create tables, produce graphs and do your statistics, all within the same program. So with R, there is no need to use more than one program to manage data for your publications. Everything can happen in one single program.
- More and more scientists are using R every year. This means that its capacities are constantly growing and will continue to increase over time. This also means that there is a big online community of people that can help with any problems you have in R.

3.3 Using RStudio
RStudio is an integrated development environment (IDE) for R. Basically, it’s a place where you can easily use the R language, visualize tables and figures and even run all your statistical analyses. We recommend using it instead of the traditional command line as it provides great visual aid and a number of useful tools that you will learn more about over the course of this workshop.
It includes a console, and a syntax-highlighting editor that supports direct code execution with tools for plotting, history, debugging and workspace management.
It integrates with R (and other programming languages) to provide a lot of useful features:
- RStudio supports authoring HTML, PDF, Word, and presentation documents
- RStudio supports version control with Git (direction to Github) and Subversion
- RStudio makes it easy to start new or find existing projects
- RStudio supports interactive graphics with Shiny and ggvis
There are other IDE for R: Atom, Visual Studio, Jupyter notebook, and Jupyter lab
3.3.1 CHALLENGE 1
Open RStudio

RStudio logo
Note for Windows users: If the restriction “unable to write on disk” appears when you try to open R-Studio, right-click on your R-Studio icon and chose:“Execute as administrator” to open the program.
3.3.2 The RStudio interface
When you open RStudio for the first time, the screen will be divided across three main Pane groups:
- Console, Terminal, Job group;
- Environment, History, Connections group;
- Files, Plot, Packages, Help, Viewer panes; and
- Script pane group
Once you Open a Script or Create a New Script (File > New File > R script or Ctrl/Cmd + Shift + N), the fourth panel will appear.
3.3.3 The RStudio Console
The first thing that you see to the left of the screen is the “console”. This is where we will be working for the rest of this Introduction to R workshop.
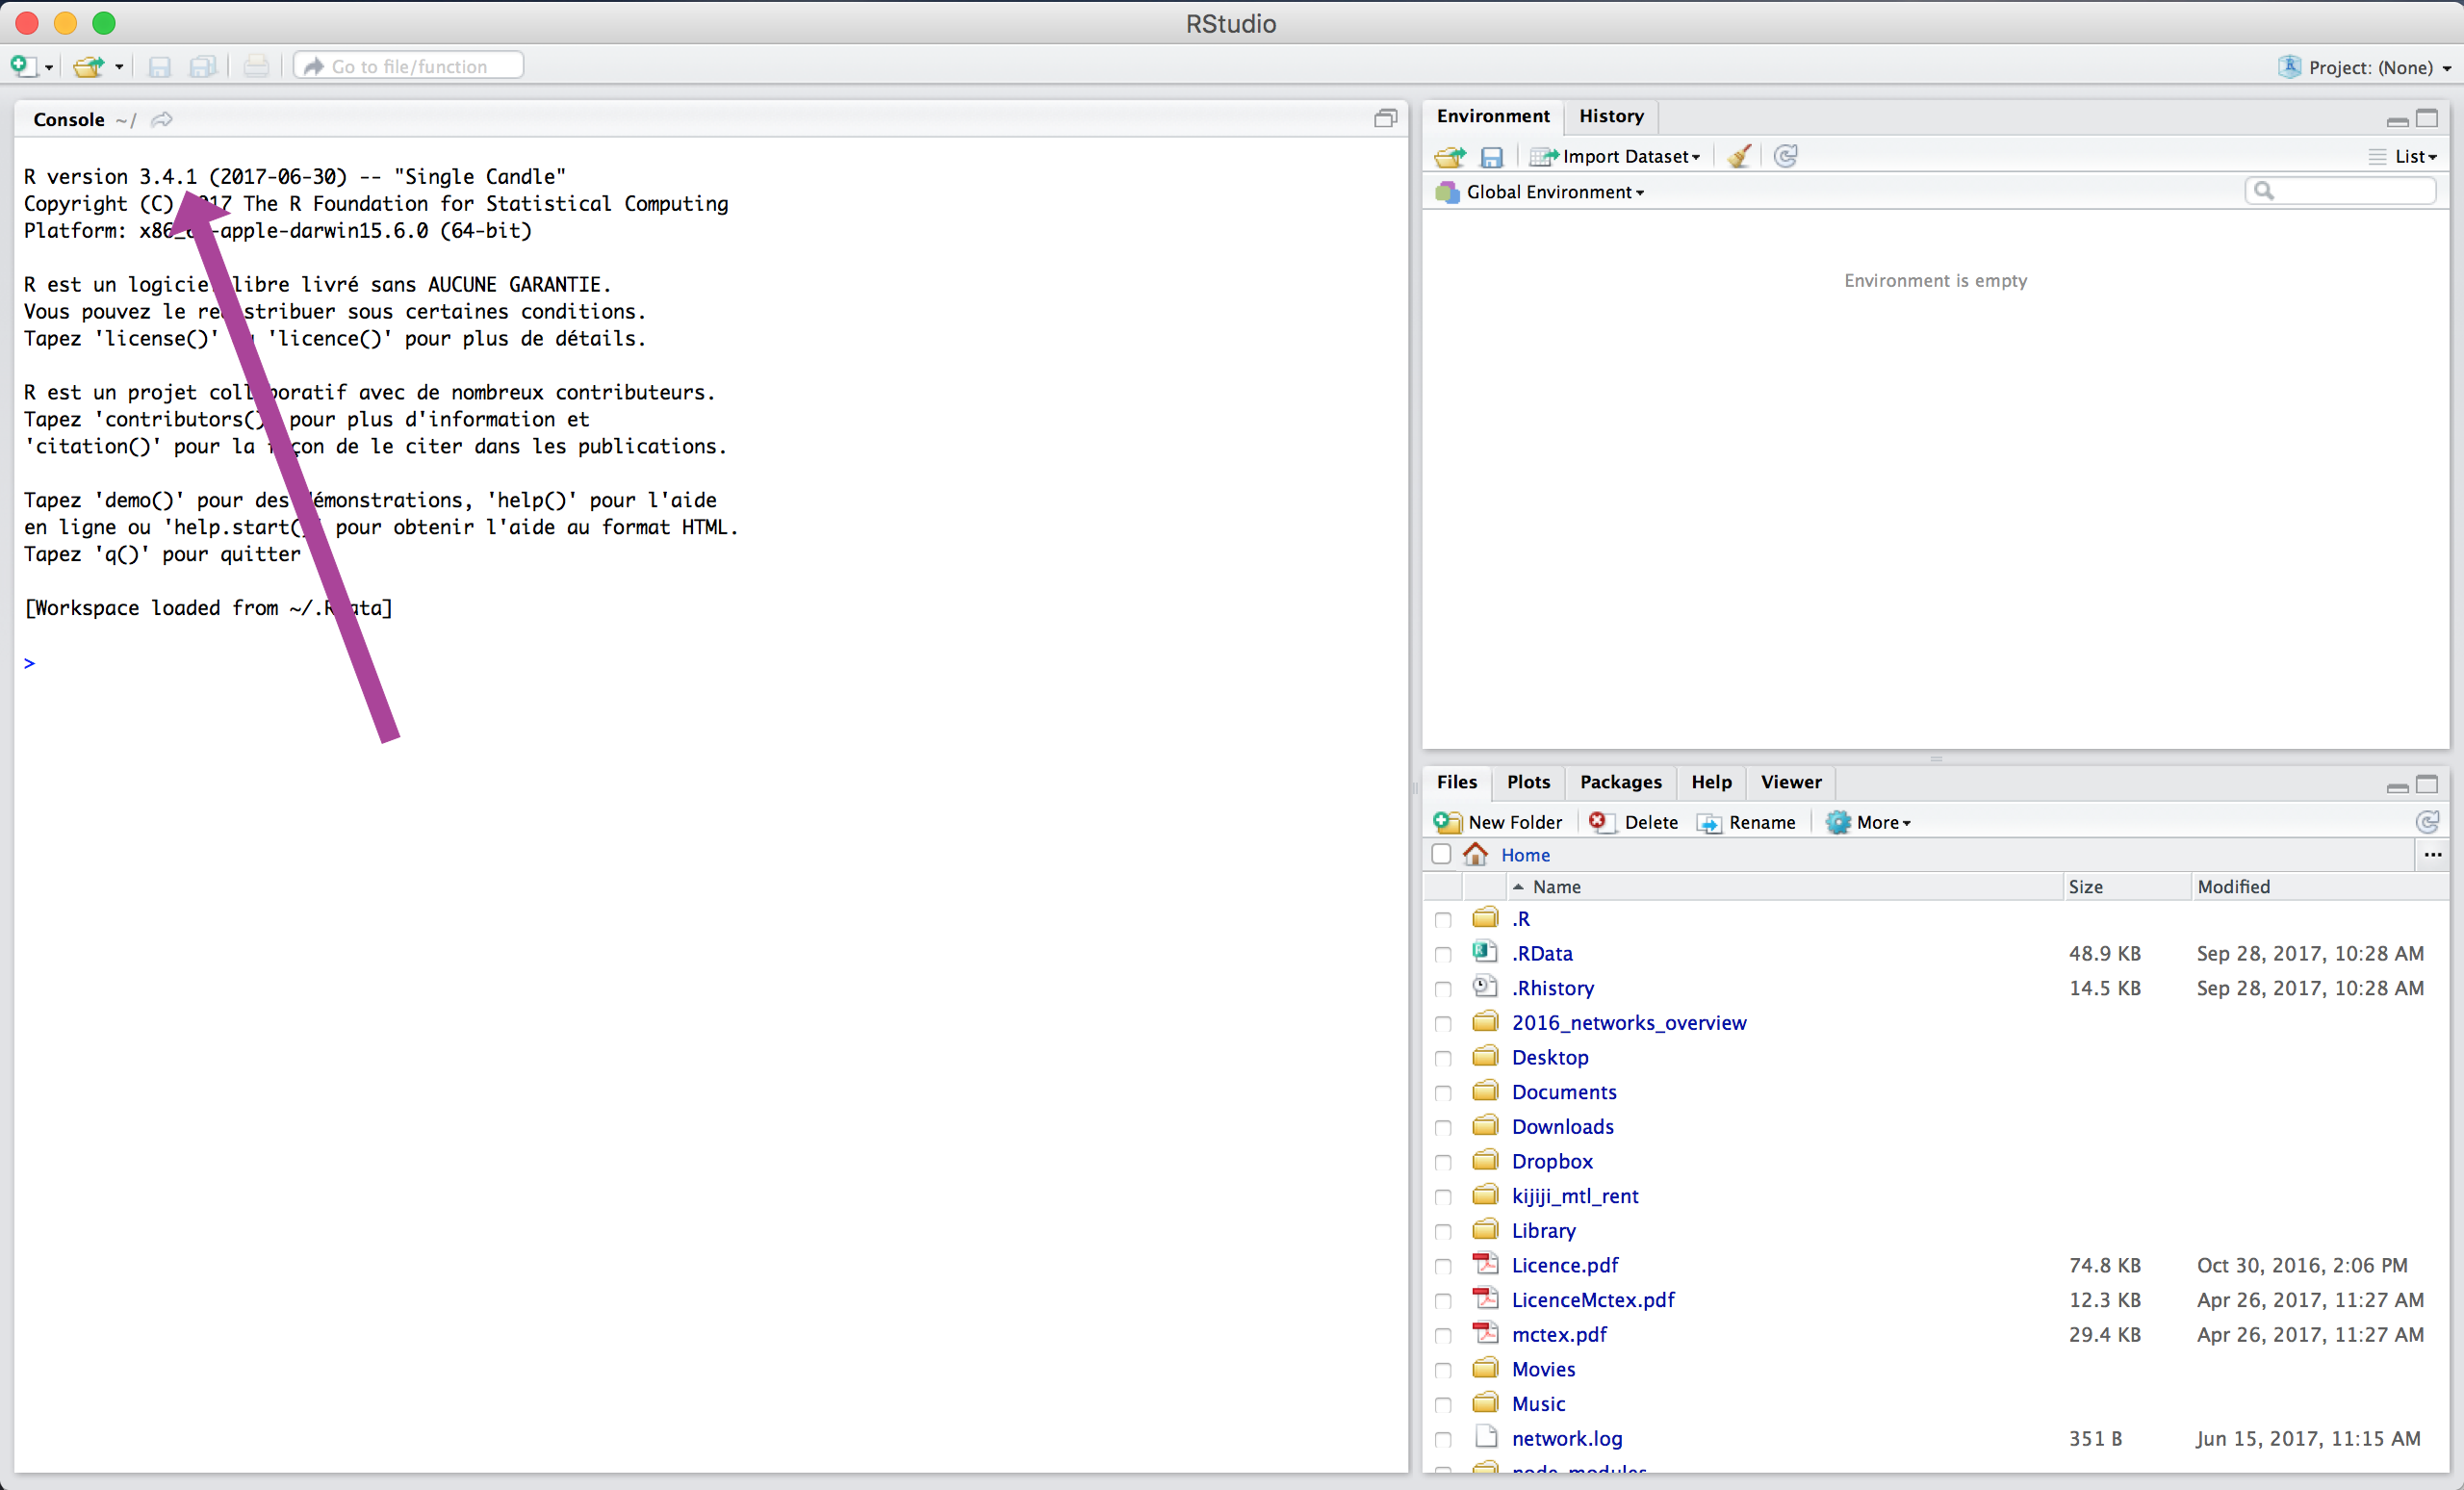
Text in the console typically looks like this:
output <- "This is the output"
output
## [1] "This is the output"Note 1: You always have to push “enter” for the input to run in the console.
Note 2: People often wonder what the brackets in front of the output mean. They are there to help you locate “where” you are in the output. For example, if you ask R to output numbers between 1 and 10 and the output is on 2 rows, the bracket at the start of the 2nd row will help you understand at which value of the output you are situated:
[1] 1 2 3 4 5
[6] 6 7 8 9 10
3.4 Errors and Warnings
Often, the Console will output Errors and Warning messages.