Chapter 4 Why use R?
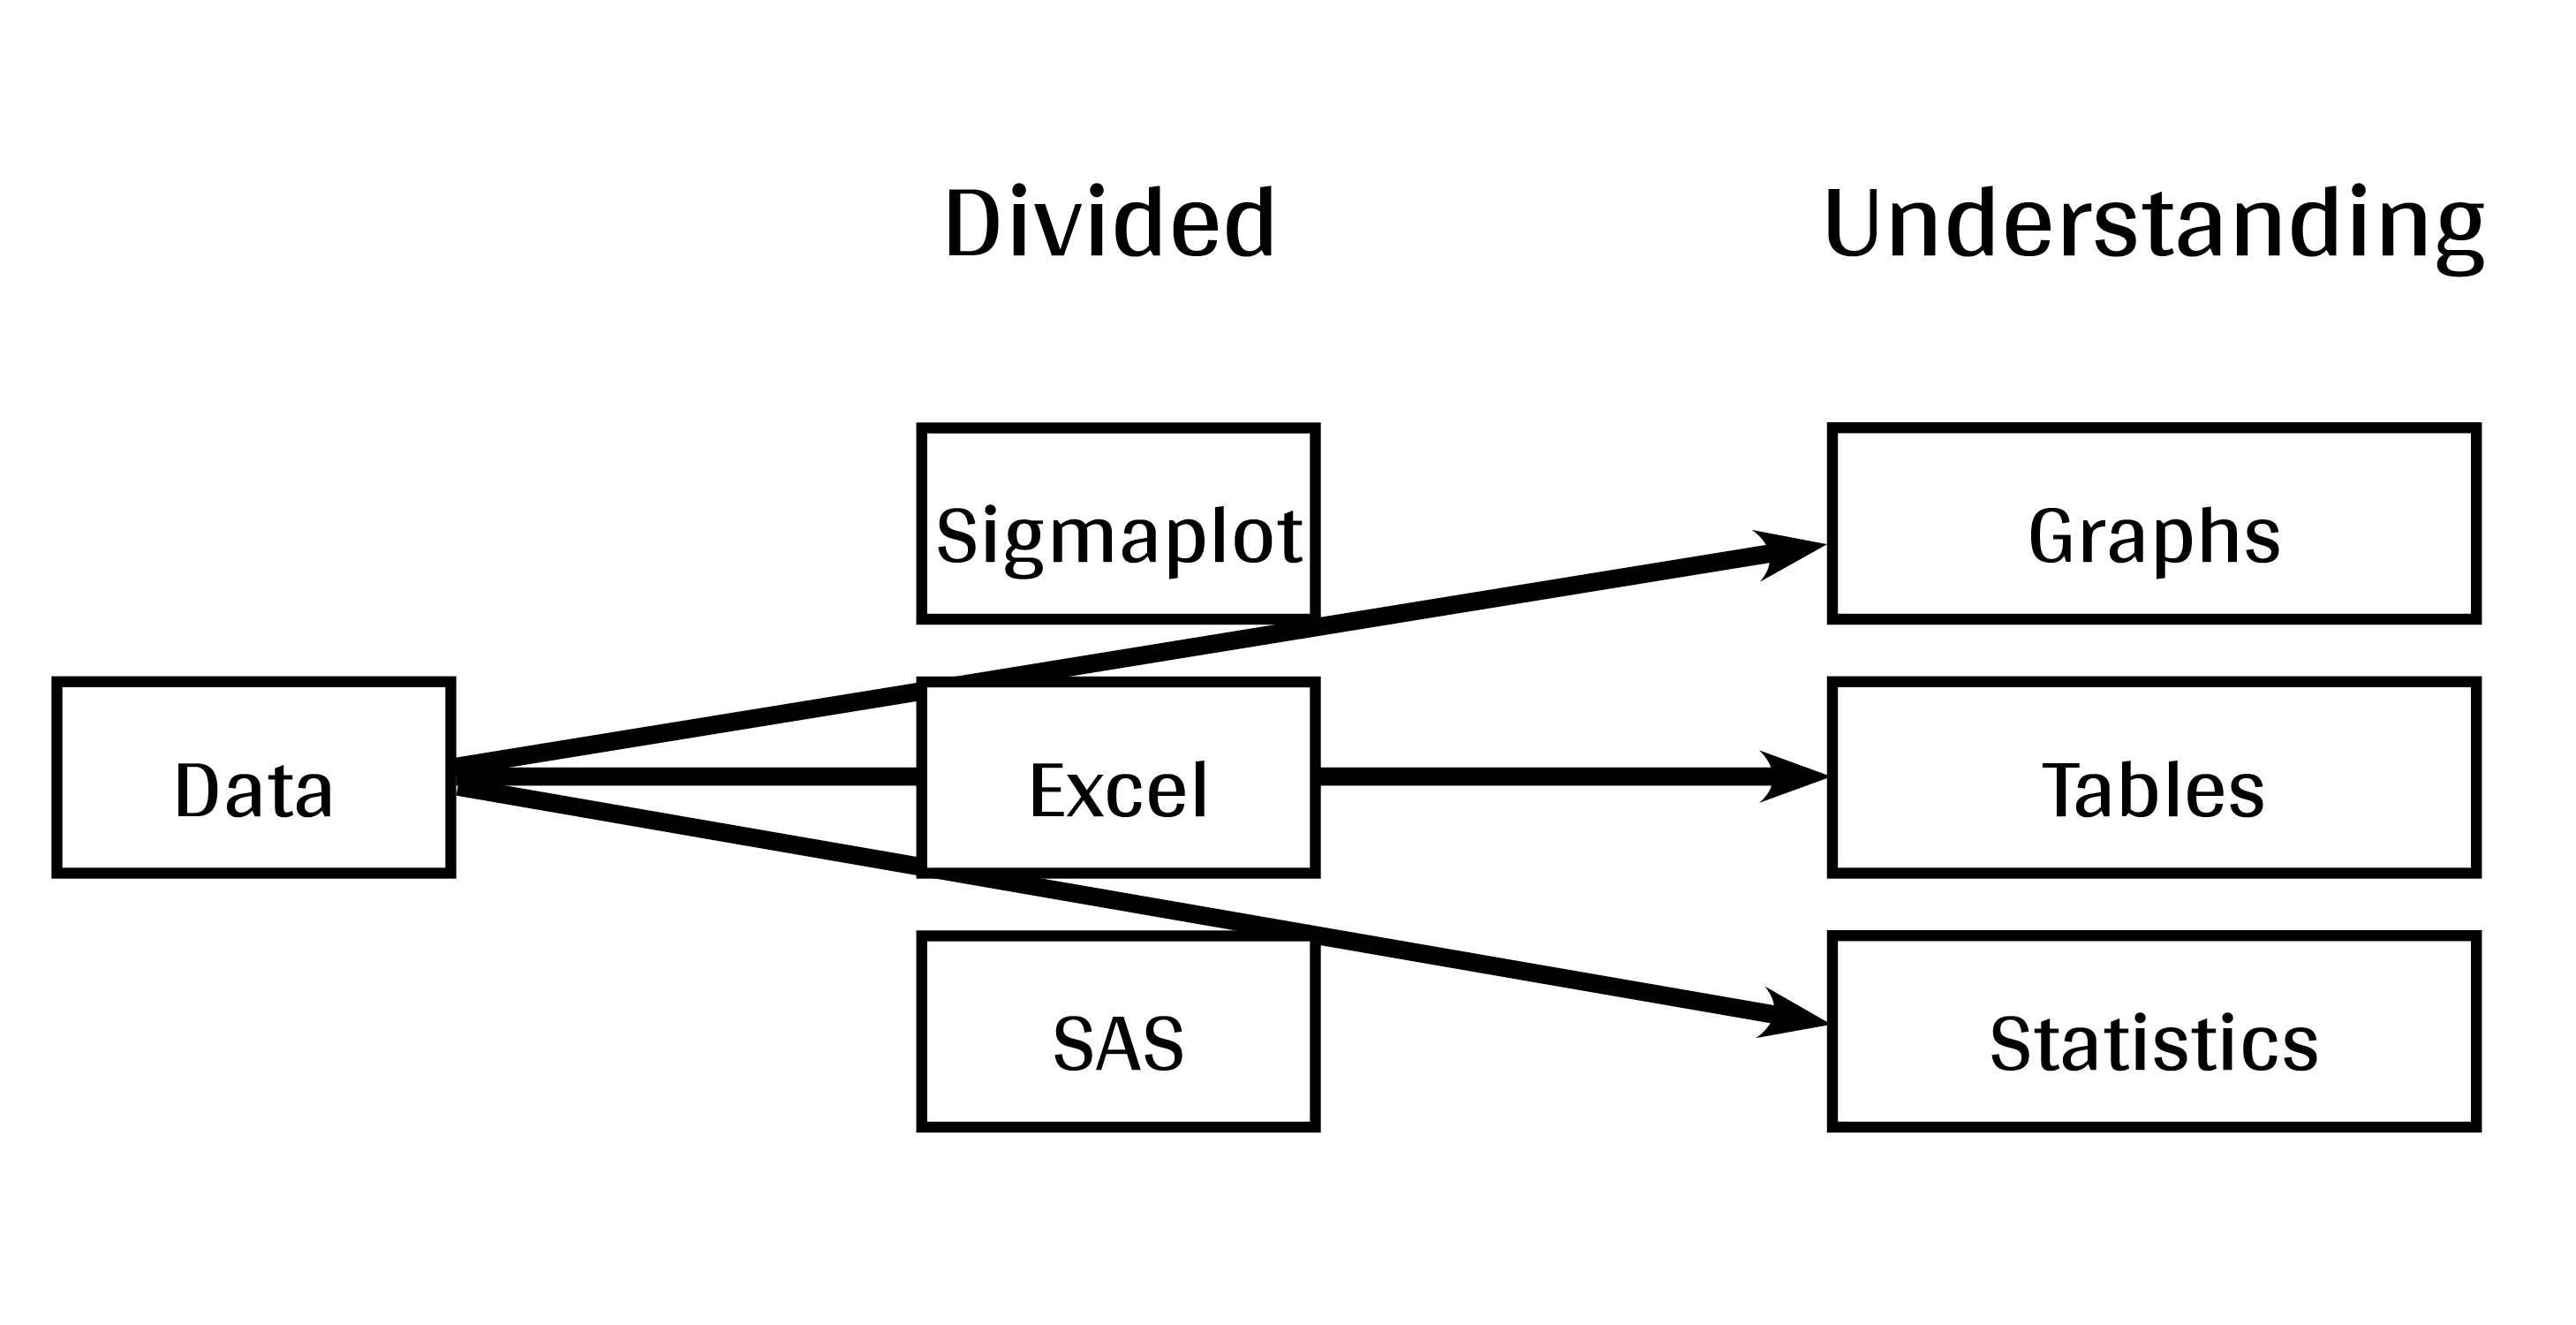
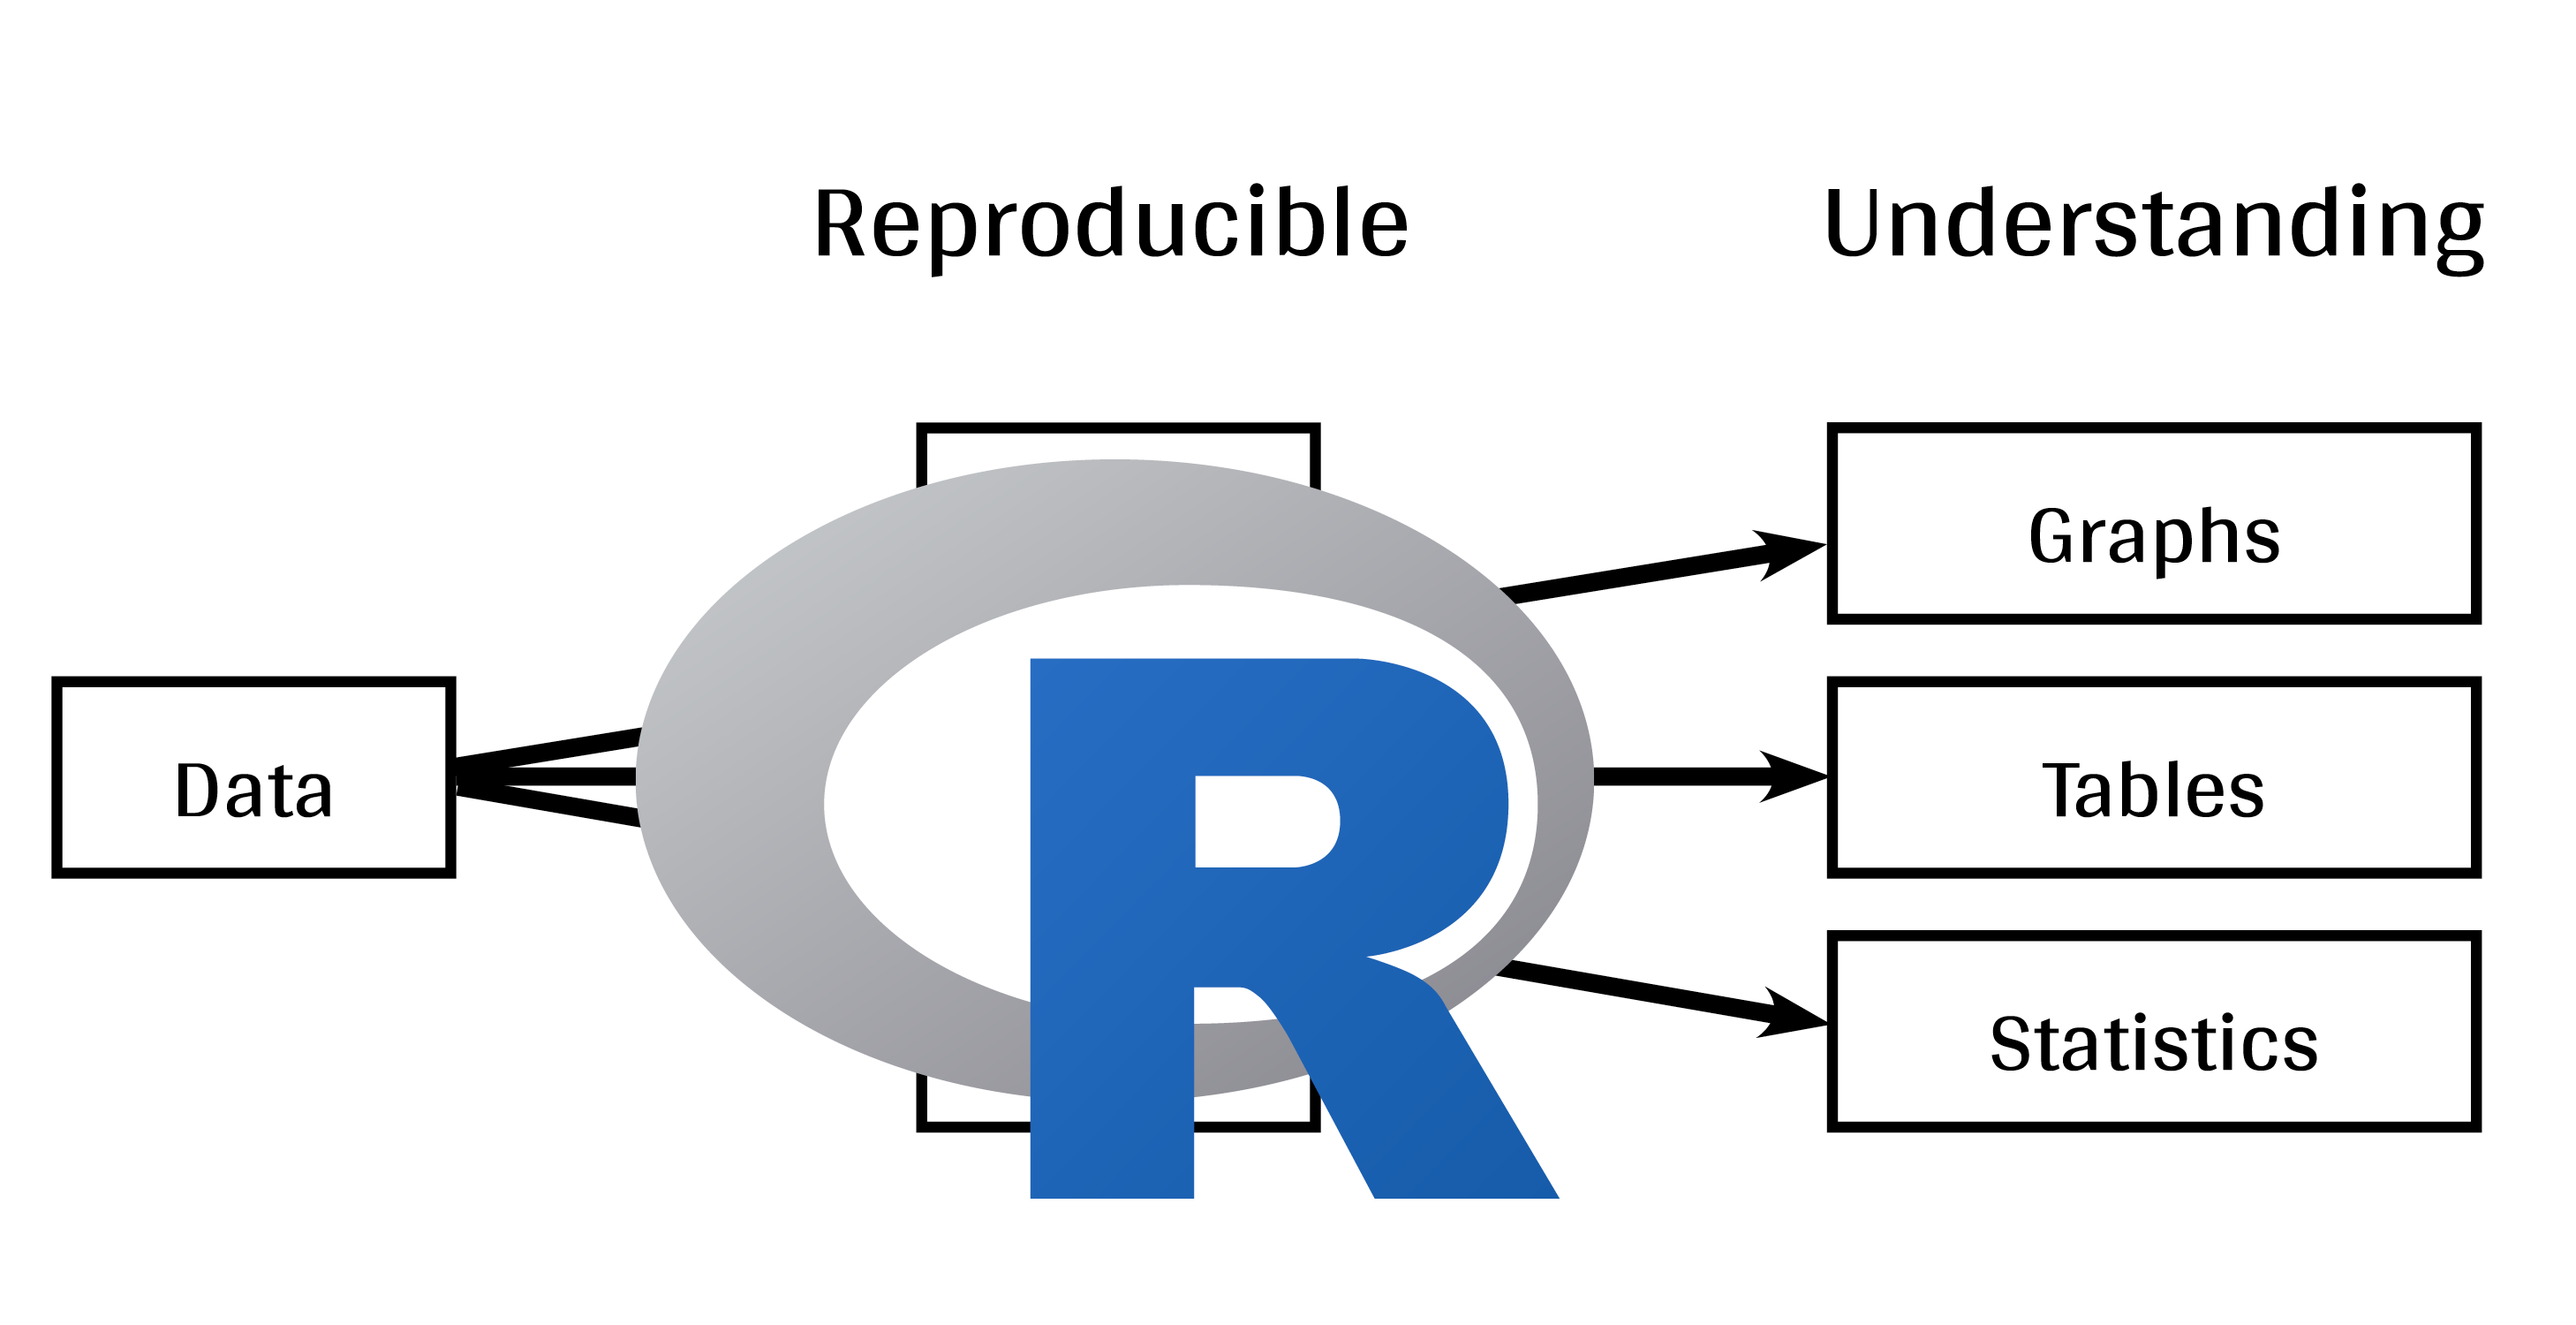
Whether you are calculating summary statistics (e.g. Excel), performing more advanced statistical analysis (e.g. JMP, SAS, SPSS), or producing figures and tables (e.g. Sigmaplot, Excel), it is easy to get lost in a workflow when you are using a variety of software. This can become especially problematic when you import and export your dataset to accomplish a downstream task. With each operation, you increase the risk of introducing errors into your data or losing track of the correct version of your data. R provides a solution to this by unifying all of the tools you need for advanced data manipulation, statistical analysis, and powerful graphical engines in a single programming language. By unifying your workflow with R, you can reduce the chance of making mistakes and ensure your work is reproducible. Believe us, the future “you” will not regret it!
Instead of using a suite of software tools…
You can use R to generate reproducible data visualizations all within a single program, R Studio.
What is the advantage to using R for data visualization?
4.1 Reproducibility
One of the main reasons to use R for plotting is that it makes your visualization entirely reproducible. You can annotate your script, add additional information (ex. titles, labels, captions, etc), and maintain the code for all versions of your figures so you always know how it was produced.
Reproducible science comes with effort, but it is quickly becoming an industry standard and is an investment that will save you and your collaborators a lot of time in the long run!
4.2 Powerful features
Another reason to use R is its powerful features, like ggplot2.
The ggplot2 package is the most flexible and complete package available for advanced data visualization in R. This package was created for R by Hadley Wickham based on the Grammar of Graphics by Leland Wilkinson.
Figure 4.1: The source code for the ggplot2 package is hosted on GitHub: github.com/hadley/ggplot2.
In this workshop, we focus only on ggplot2, but there are many other packages and functions that can be used for great visualization (e.g., base R, plotly, sjPlot, mapview, igraph). Here are some examples of the plots you can make with base R, or with ggplot2.
 data package.](images/multiExamplePlot.png)
Figure 4.2: A small sample of plots you can make with base R (row 1) and ggplot2 (row 2), based on the palmerpenguins data package.
The reason that we focus on ggplot2 is due to its versatility.
1. The ggplot2 package lets you make beautiful and customizable plots;
2. It implements the grammar of graphics, which is a reliable system for building plots.
3. There are many extensions available to add even more features to ggplot2, allowing for a wealth of applications.