Chapter 23 Modifier un graphique en utilisant for et if.
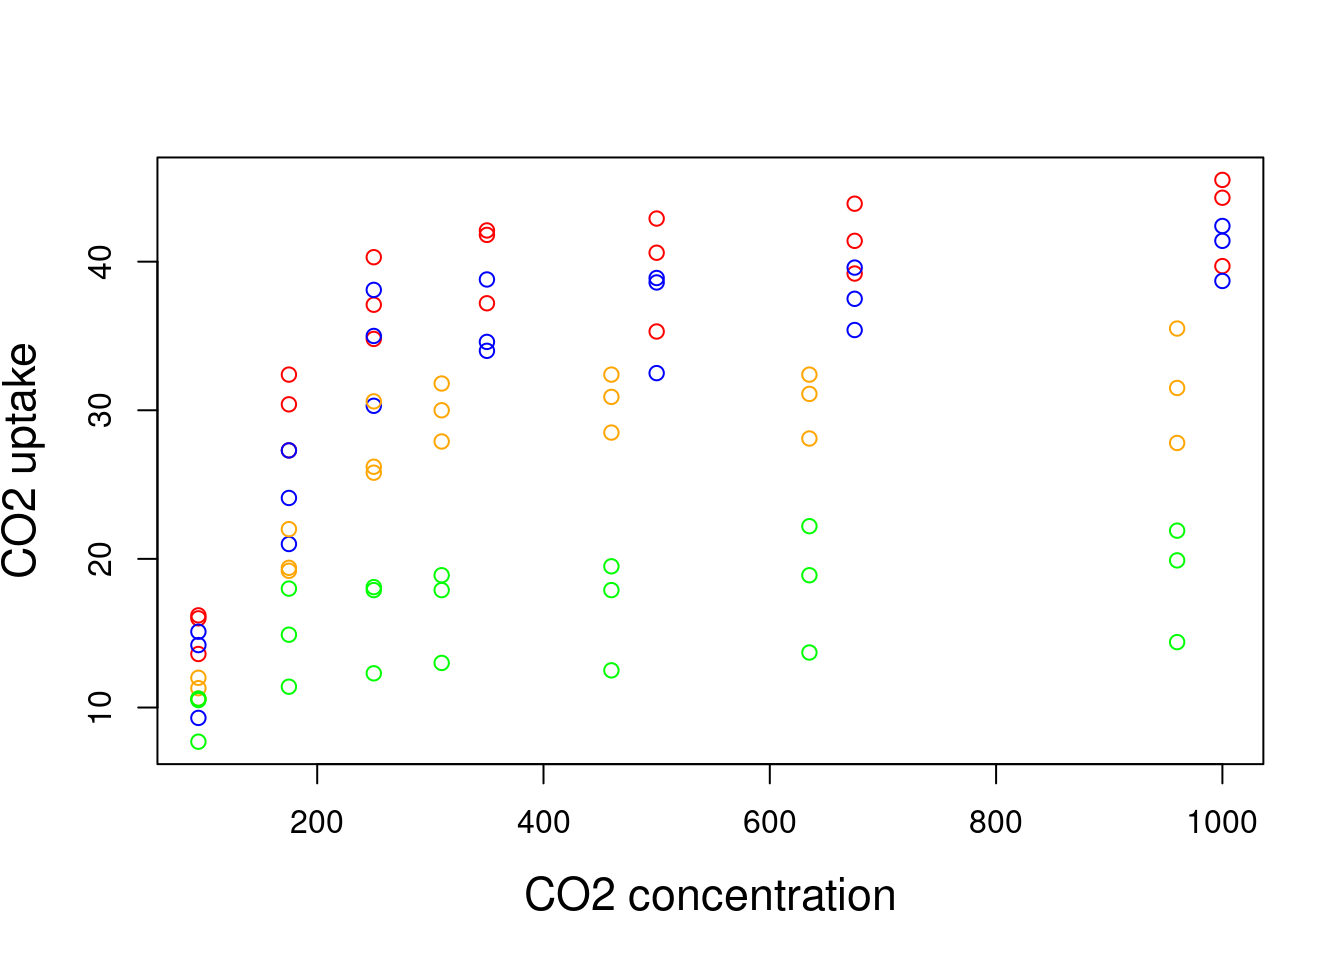
Représentons l’absorption envers la concentration avec des points de couleurs différentes selon leur type (Québec ou Mississippi) et leur traitement (réfrigéré ou non).
plot(x = CO2$conc, y = CO2$uptake, type = "n", cex.lab = 1.4,
    xlab = "CO2 concentration", ylab = "CO2 uptake")
# Type 'n' tells R to not actually plot the points.
for (i in 1:length(CO2[, 1])) {
    if (CO2$Type[i] == "Quebec" & CO2$Treatment[i] == "nonchilled") {
        points(CO2$conc[i], CO2$uptake[i], col = "red")
    }
    if (CO2$Type[i] == "Quebec" & CO2$Treatment[i] == "chilled") {
        points(CO2$conc[i], CO2$uptake[i], col = "blue")
    }
    if (CO2$Type[i] == "Mississippi" & CO2$Treatment[i] == "nonchilled") {
        points(CO2$conc[i], CO2$uptake[i], col = "orange")
    }
    if (CO2$Type[i] == "Mississippi" & CO2$Treatment[i] == "chilled") {
        points(CO2$conc[i], CO2$uptake[i], col = "green")
    }
}