class: center, middle, inverse, title-slide # Workshop 4: Linear models ## QCBS R Workshop Series ### Québec Centre for Biodiversity Science --- --- class: inverse, center, middle # Important concepts ## mean and variation --- ## Mean Mean is a measure of the average value of a population (*x*): `$$\bar{x} = \frac{1}{N} \sum_{i=1}^{n} x_{i}$$` --- ## Variation - Variation is the spread around the mean - Mean deviation - Variance - Standard deviation - Coefficient of deviation **What is deviation?** `$$D_{i} = |x_{i} - \bar{x}|$$` --- ## Variation **Deviation**: `$$D_{i} = |x_{i} - \bar{x}|$$` -- **Mean deviation**: `$$D = \frac{1}{N} \sum_{i=1}^{n} |x_{i} - \bar{x}|$$` -- Instead of absolute values, we can also square the value, giving the **variation**: `$$V = \frac{1}{N} \sum_{i=1}^{n} {(x_{i} - \bar{x})}^2$$` --- ## Variation But by squaring each value, our variables are no longer in meaningful units So we just root square the **variation** ( `\(V\)` ), giving the **standard variation**: `$$\sigma = \sqrt{V}$$` -- The relative standard deviation, expressed in percentage, is the **coefficient of variation**: `$$cv = \frac{\sigma}{\bar{x}}$$` --- class: inverse, center, middle # Linear models --- ## What are linear models Linear relationship between response ( `\(Y\)` ) and explanatory ( `\(X\)` ) variable, using the concepts of **mean** and **variation** - `\(Y\)` : variable you want to explain (only one response variable) - `\(X\)` : explain your response variable (one or more explanatory variables) - `\(Y\)` : must be continuous - `\(X\)` : continuous or categorical - `\(\epsilon\)` : what is not explained by the explanatory variable(s)  residuals or error --- ## Defining linear models Putting everything together: `$$Y_{i} = \beta_{0} + \beta_{1} x_{i1} + \cdots + \beta_{p} x_{ip} + \epsilon_{i}$$` - `\(Y_i\)` is the response variable - `\(β_0\)` is the intercept of the regression line - `\(β_1\)` is the coefficient of variation for the first explanatory variable - `\(β_p\)` is the coefficient of variation for the *nth* explanatory variable - `\(x_i1\)` is the first explanatory variable - `\(x_ip\)` is the *nth* explanatory variable - `\(ε_i\)` are the residuals of the model --- ## The goal of linear models - The goal is to find the **best estimation** of the parameters (the `\(\beta\)` variables) and then assess the goodness of fit of the model - Several methods to calculate the intercept and coefficients of linear models - the appropriate choice depends on the kind of explanatory variables considered and their number .center[.large[The general concept behind these methods is that the residuals are minimized]] --- ## Learning objectives .center[  ] --- ## Linear model assumptions 1. The residuals are independent 2. The residuals are normally distributed 3. The residuals have a mean of 0 4. The residuals are homoskedastic (they have constant variance) .alert[These assumptions concern the residuals, not the response or explanatory variables] .small[.comment[In the following sections, we do not always explicitly restate the above assumptions for every model because these assumption are implicit in all linear models]] --- ## Work follow .center[  ] - Plot the data - Create a model - Test the model assumptions - Adjust the model if assumptions are violated - Interpret the model results --- class: inverse, center, middle # Simple linear regression --- ## Simple linear regression - Type of linear model which contains a single, continuous explanatory variable `$$Y_i = \beta_0 + \beta_1 x_i + \epsilon_i$$` - Estimates the **intercept** ( `\(\beta_0\)` ) and a **coefficient of correlation** ( `\(\beta_1\)` ) - Ordinary least squares methods - Most used method and corresponds to the default function in R --- ## Least squares methods .pull-left[ .center[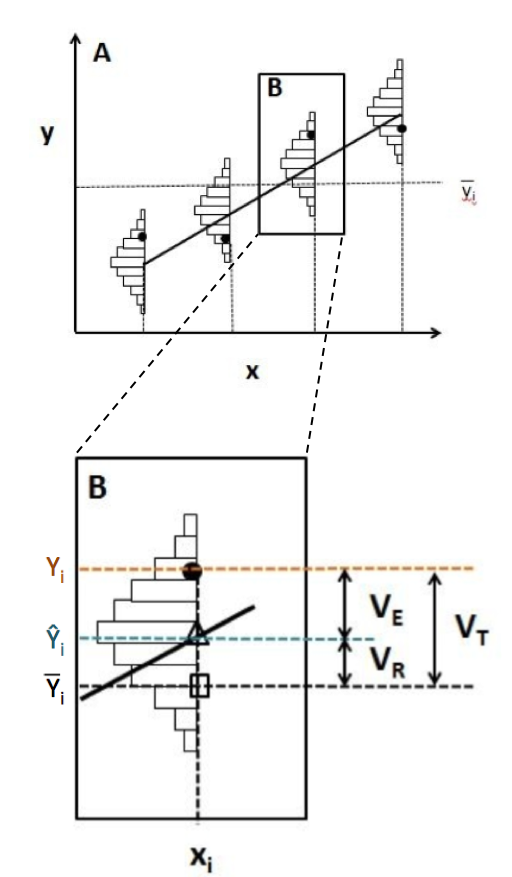] ] .pull-right[ **Assumptions** - `\(Y_i\)` : Observed value (measured) at `\(X_i\)` - `\(\widehat{Y}_i\)` : Predicted value at `\(X_i\)` - `\(\bar{Y}\)` : Mean value of all `\(Y_i\)` - `\(V_E\)` : Residual variance (error) - `\(V_R\)` : Variance explained by the regression - `\(V_T\)` : Total variance - `\(R^2 = \frac{V_R}{V_T}\)` ] --- ## Running a regression in R .small[ **Step 1**. Run your linear model **Step 2**. Verify assumptions ] .pull-left[.center[]] .pull-right[.center[]] .pull-left[.center[*Assumptions are met?*] .small[**Step 3**. Estimate regression parameters, test significance, plot your model ]] .pull-right[.center[*Assumptions are not met?*] .small[*Can you transform your variables (and does it make sense to do so)?*] .pull-left[.center[]] .pull-right[.center[]] .small[ .pull-left[ Yes: Go back to Step 1 with transformed variables ] .pull-right[ No: Try GLM that might better suit your data ]]] --- ## Running a regression in R **Step 1**. Run your linear model In R, the function `lm()` is used to fit a linear model ```r lm1 <- lm(Y~X) ``` - `lm1` : New object containing the linear model we created - `Y` : Response variable - `X` : Explanatory variable --- ## Running a regression in R Download the <span style="color:blue"> *birdsdiet* </span> dataset: ```r bird <- read.csv("birdsdiet.csv") ``` Visualize the data using the structure `str()` command: ```r str(bird) # 'data.frame': 54 obs. of 7 variables: # $ Family : Factor w/ 53 levels "Anhingas","Auks& Puffins",..: 18 25 23 21 2 10 1 44 24 19 ... # $ MaxAbund : num 2.99 37.8 241.4 4.4 4.53 ... # $ AvgAbund : num 0.674 4.04 23.105 0.595 2.963 ... # $ Mass : num 716 5.3 35.8 119.4 315.5 ... # $ Diet : Factor w/ 5 levels "Insect","InsectVert",..: 5 1 4 5 2 4 5 1 1 5 ... # $ Passerine: int 0 1 1 0 0 0 0 0 0 0 ... # $ Aquatic : int 0 0 0 0 1 1 1 0 1 1 ... ``` --- ## Running a regression in R Response variable: **Bird abundance**  num: continuous Explanatory variable: **Bird mass**  num: continuous ```r str(bird) # 'data.frame': 54 obs. of 7 variables: # $ Family : Factor w/ 53 levels "Anhingas","Auks& Puffins",..: 18 25 23 21 2 10 1 44 24 19 ... # $ MaxAbund : num 2.99 37.8 241.4 4.4 4.53 ... # $ AvgAbund : num 0.674 4.04 23.105 0.595 2.963 ... # $ Mass : num 716 5.3 35.8 119.4 315.5 ... # $ Diet : Factor w/ 5 levels "Insect","InsectVert",..: 5 1 4 5 2 4 5 1 1 5 ... # $ Passerine: int 0 1 1 0 0 0 0 0 0 0 ... # $ Aquatic : int 0 0 0 0 1 1 1 0 1 1 ... ``` We first want to test if bird maximum abundance is a function of bird mass ```r lm1 <- lm(MaxAbund ~ Mass, data = bird) ``` --- ## Running a regression in R **Step 2**. Verify assumptions using diagnostic plots ```r opar <- par(mfrow=c(2,2)) plot(lm1) ``` - `par( )`: sets the graphical parameters, for example, the `mfrow` argument sets the number of rows in the frame - `plot( )`: is a generic function to plot graphics in R The output will provide the four built-in diagnostic plots of the `lm()` function --- ## Diagnostic plot # 1 - Residuals vs Fitted Example of independence (what we want!) - Should show a scatter across and no pattern <img src="workshop04-en_files/figure-html/unnamed-chunk-10-1.png" width="396" style="display: block; margin: auto;" /> --- ## Diagnostic plot # 1 - Residuals vs Fitted <img src="workshop04-en_files/figure-html/unnamed-chunk-11-1.png" width="612" style="display: block; margin: auto;" /> - Solution: Transform your data or try another distribution than linear (Gaussian) (i.e., a generalized linear model (GLM): Poisson, binomial, negative binomial, etc.) --- ## Diagnostic plot # 2 - Scale Location - Should show a scatter across and no pattern <img src="workshop04-en_files/figure-html/unnamed-chunk-12-1.png" width="576" style="display: block; margin: auto;" /> .pull-left[.center[]] .pull-right[.center[]] .pull-left[.center[No pattern in the residuals]] .pull-right[.center[Strong pattern in the residuals]] --- ## Diagnostic plot # 3 - Normal QQ - Compares the distribution (quantiles) of the residuals of the current model to those of a normal distribution - If points lie linearly on the 1:1 line, data follow a normal distribution <img src="workshop04-en_files/figure-html/unnamed-chunk-13-1.png" width="576" style="display: block; margin: auto;" /> .pull-left[.center[]] .pull-right[.center[]] .pull-left[.center[Good!]] .pull-right[.center[Not that good...]] --- ## Diagnostic plot # 4 - Residuals vs Leverage - Looks for influential values - **Leverage points**: observations at extreme/ outlying values of the explanatory variable. Because they lack neighboring observations, the regression model passes close to leverage points. **They may OR may not have a high influence on the regression.** - High leverage points with high influence can be identified with a **Cook's distance greater than 0.5** --- ## Leverage vs influence <img src="workshop04-en_files/figure-html/unnamed-chunk-14-1.png" width="360" style="display: block; margin: auto;" /> --- ## Leverage vs influence <img src="workshop04-en_files/figure-html/unnamed-chunk-15-1.png" width="648" style="display: block; margin: auto;" /> .pull-left[.center[]] .pull-right[.center[]] .pull-left[.center[No influential values]] .pull-right[.center[High leverage point and reasonable influence]] <br /> <br /> <br /> .comment[Point 29 has high leverage but its influence is acceptable (inside the 0.5 Cook's distance limits)] --- ## Leverage vs influence High leverage point and high influence <br /> .pull-left[ <img src="workshop04-en_files/figure-html/unnamed-chunk-16-1.png" width="288" style="display: block; margin: auto;" /> ] .pull-right[ - Point 29 is outside the 0.5 limit of Cook's distance - These points have too much influence on the regression ] .alert[You should never remove outliers if you don't have good reasons to do so (ex: error of measurement)] --- ## **Step 2**. Verify assumptions of `lm1` ```r par(mfrow=c(2,2), mar = c(4,4,2,1.1), oma =c(0,0,0,0)) plot(lm1) ``` <img src="workshop04-en_files/figure-html/unnamed-chunk-17-1.png" width="396" style="display: block; margin: auto;" /> --- ## Assumptions not met - what is wrong? Plot Y ~ X with corresponding best-fit regression line, and a histogram of Y and X to explore their distributions ```r plot(bird$MaxAbund ~ bird$Mass) abline(lm1) # adds the best-fit line hist(bird$MaxAbund) # hist() produces a histogram of the variable hist(bird$Mass) ``` <img src="workshop04-en_files/figure-html/unnamed-chunk-18-1.png" width="648" style="display: block; margin: auto;" /> --- ## Assumptions not met - what is wrong? Can also use the **`Shapiro-Wilk`** and the `Skewness` tests to see if variables follow a normal distribuon: ```r shapiro.test(bird$MaxAbund) # # Shapiro-Wilk normality test # # data: bird$MaxAbund # W = 0.5831, p-value = 3.872e-11 shapiro.test(bird$Mass) # # Shapiro-Wilk normality test # # data: bird$Mass # W = 0.54667, p-value = 1.155e-11 ``` .comment[In both cases, distributions are significantly different from normal] --- ## Assumptions not met - what is wrong? Can also use the `Shapiro-Wilk` and the **`Skewness`** tests to see if variables follow a normal distribuon: ```r skewness(bird$MaxAbund) # [1] 3.167159 skewness(bird$Mass) # [1] 3.146062 ``` .comment[The positive skewness values also indicate that the distributions are left skewed] --- ## Transform the data - Lets try normalizing data with a `log10()` transformation - Add the log-transformed variables to our data frame ```r bird$logMaxAbund <- log10(bird$MaxAbund) bird$logMass <- log10(bird$Mass) ``` **Step 1**: Re-run the analysis with log-transformed variables ```r lm2 <- lm(logMaxAbund ~ logMass, data = bird) ``` --- ## **Step 2**: Verify assumptions of model `lm2` ```r par(mfrow=c(2,2), mar=c(3,4,1.15,1.2)) plot(lm2) ``` <img src="workshop04-en_files/figure-html/unnamed-chunk-23-1.png" width="424.8" style="display: block; margin: auto;" /> .comment[.center[Much improved!]] --- ## **Step 2**: Verify assumptions of model `lm2` ```r plot(logMaxAbund ~ logMass, data=bird) abline(lm2) hist(log10(bird$MaxAbund)) hist(log10(bird$Mass)) ``` <img src="workshop04-en_files/figure-html/unnamed-chunk-24-1.png" width="648" style="display: block; margin: auto;" /> --- ## **Step 3**: Estimate parameters and test significance The function `summary()` is used to obtain parameter estimates, significance, etc. .small[ ```r summary(lm2) # # Call: # lm(formula = logMaxAbund ~ logMass, data = bird) # # Residuals: # Min 1Q Median 3Q Max # -1.93562 -0.39982 0.05487 0.40625 1.61469 # # Coefficients: # Estimate Std. Error t value Pr(>|t|) # (Intercept) 1.6724 0.2472 6.767 1.17e-08 *** # logMass -0.2361 0.1170 -2.019 0.0487 * # --- # Signif. codes: 0 '***' 0.001 '**' 0.01 '*' 0.05 '.' 0.1 ' ' 1 # # Residual standard error: 0.6959 on 52 degrees of freedom # Multiple R-squared: 0.07267, Adjusted R-squared: 0.05484 # F-statistic: 4.075 on 1 and 52 DF, p-value: 0.04869 ``` ] --- ## **Step 3**: Estimate parameters and test significance We can also call out specific parameters of the model, for example: ```r lm2$coef # (Intercept) logMass # 1.6723673 -0.2361498 summary(lm2)$coefficients # Estimate Std. Error t value Pr(>|t|) # (Intercept) 1.6723673 0.2471519 6.766557 1.166186e-08 # logMass -0.2361498 0.1169836 -2.018658 4.869342e-02 summary(lm2)$r.squared # [1] 0.07267022 ``` --- ## Group discussion - Can you write down the equation of the regression line for your model `lm2`? - Are the parameters significant? - What proportion of variance is explained by model `lm2`? .small[ ```r summary(lm2) # # Call: # lm(formula = logMaxAbund ~ logMass, data = bird) # # Residuals: # Min 1Q Median 3Q Max # -1.93562 -0.39982 0.05487 0.40625 1.61469 # # Coefficients: # Estimate Std. Error t value Pr(>|t|) # (Intercept) 1.6724 0.2472 6.767 1.17e-08 *** # logMass -0.2361 0.1170 -2.019 0.0487 * # --- # Signif. codes: 0 '***' 0.001 '**' 0.01 '*' 0.05 '.' 0.1 ' ' 1 # # Residual standard error: 0.6959 on 52 degrees of freedom # Multiple R-squared: 0.07267, Adjusted R-squared: 0.05484 # F-statistic: 4.075 on 1 and 52 DF, p-value: 0.04869 ``` ] --- ## Group discussion Can we improve the model if we only use terrestrial birds? .comment[You could exclude objects using `=!`] ```r lm3 <- lm(logMaxAbund~logMass, data=bird, subset=!bird$Aquatic) # removes aquatic birds (= TRUE) # or equivalently lm3 <- lm(logMaxAbund~logMass, data=bird, subset=bird$Aquatic == 0) ``` ```r # Examine the diagnostic plots par(mfrow=c(2,2)) plot(lm3) summary(lm3) # Compare both models par(mfrow=c(1,2)) plot(logMaxAbund~logMass, data=bird) plot(logMaxAbund~logMass, data=bird, subset=!bird$Aquatic) ``` --- ## Plot `R2-adj` changed from `\(0.05\)` to `\(0.25\)` when we dropped aquatic birds: ```r par(mfrow=c(1,2), mar = c(4, 4, 3, 1)) plot(logMaxAbund~logMass, data=bird, main = 'All birds') abline(lm2, col = 'red') plot(logMaxAbund~logMass, data=bird, subset=!bird$Aquatic, main = 'Terrestrial birds') abline(lm3, col = 'red') ``` <img src="workshop04-en_files/figure-html/unnamed-chunk-30-1.png" width="504" style="display: block; margin: auto;" /> --- ## Challenge 1 ![:cube]() - Examine the relationship between `log(MaxAbund)` and `log(Mass)` for passerine birds - Save the model object as `lm4` .comment[HINT: Passerine is also coded 0 and 1 (look at `str(bird)`)] - Compare the variance explained by `lm2`, `lm3` and `lm4` --- ## Challenge 1 - Solution ![:cube]() <br> ```r # Run the model lm4 <- lm(logMaxAbund ~ logMass, data=bird, subset=bird$Passerine == 1) summary(lm4) # # Call: # lm(formula = logMaxAbund ~ logMass, data = bird, subset = bird$Passerine == # 1) # # Residuals: # Min 1Q Median 3Q Max # -1.24644 -0.20937 0.02494 0.25192 0.93624 # # Coefficients: # Estimate Std. Error t value Pr(>|t|) # (Intercept) 1.2429 0.4163 2.985 0.00661 ** # logMass 0.2107 0.3076 0.685 0.50010 # --- # Signif. codes: 0 '***' 0.001 '**' 0.01 '*' 0.05 '.' 0.1 ' ' 1 # # Residual standard error: 0.5151 on 23 degrees of freedom # Multiple R-squared: 0.02, Adjusted R-squared: -0.02261 # F-statistic: 0.4694 on 1 and 23 DF, p-value: 0.5001 ``` --- ## Challenge 1 - Solution ![:cube]() ```r # diagnostic plots par(mfrow=c(2,2), mar = c(4,4,2,1.1), oma =c(0,0,0,0)) ``` <img src="workshop04-en_files/figure-html/unnamed-chunk-32-1.png" width="468" style="display: block; margin: auto;" /> --- ## Challenge 1 - Solution ![:cube]() Compare variance explained by `lm2`, `lm3` and `lm4` ```r # Recall: we want adj.r.squared summary(lm2)$adj.r.squared # [1] 0.05483696 summary(lm3)$adj.r.squared # [1] 0.2484544 summary(lm4)$adj.r.squared # [1] -0.02260731 ``` .comment[The best model among the three models is `lm3` *(only terrestrial birds)*] --- ## Learning objectives .center[ 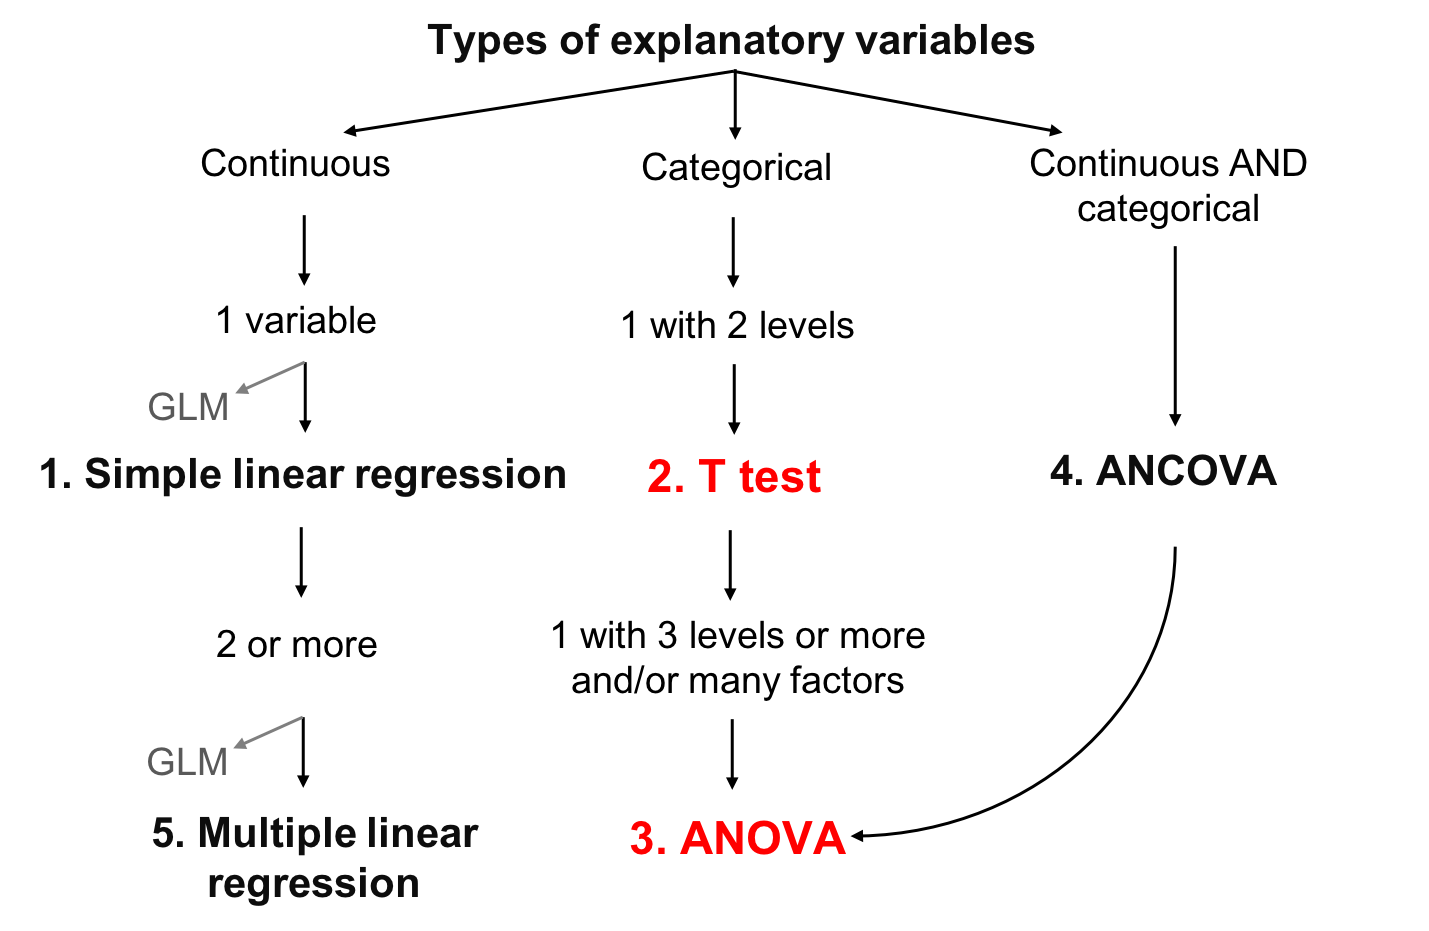 ] --- class: inverse, center, middle # ANOVA ## T-test, One-way ANOVA, Two-way ANOVA --- ## ANOVA Continuous response variable **Categorical explanatory variables** - Two or more levels (groups) .large[.center[ANOVA tests whether the means of the response variable differs between the levels]] Sum of squares: within-treatment variance *vs* between-treatment variance If between-treatment variance `\(>\)` within-treatment variance: - The treatments affect the explanatory variable more than the random error - The explanatory variable is likely to be significantly influenced by the treatments --- ## Types of ANOVA 1. One-way ANOVA - One factor with 2 or more levels - If there are 2 levels a **t-test** can be used alternatively 2. Two-way ANOVA - 2 factors or more - Each factor can have multiple levels - The interactions between each factor must be tested 3. Repeated measures? - ANOVA can be used for repeated measures, but we won't cover this today - Linear Mixed-effect Models can also be used for this kind of data (you'll see it on Workshop 6) --- class: inverse, center, middle # T-test --- ## T-test - **Response variable**  Continuous - **Explanatory variable**  Categorical with **2 levels** **Assumptions** - Data follow a normal distribution - Equality of variance between groups (Homoscedasticity) .comment[robustness of this test increases with sample size and is higher when groups have equal sizes] --- ## Running a T-test in R Use the function `t.test()` ```r t.test(Y~X2, data= data, alternative = "two.sided") ``` - `Y`: response variable - `X2`: factor (2 levels) - `data`: name of dataframe - `alternative` hypothesis: `"two.sided"` (default), `"less"`, or `"greater"` The t-test is still a linear model and a specific case of ANOVA with one factor with 2 levels Thus the function `lm()` can also be used ```r lm.t <-lm(Y~X2, data = data) anova(lm.t) ``` --- ## Running a T-test in R .large[Are aquatic birds heavier than non-aquatic birds?] - Response variable: `Bird mass`  num: Continuous - Explanatory variable: `Aquatic`  2 levels: 1 or 0 (yes or no) --- ## Running a T-test in R First, lets visualize the data using the function `boxplot()` ```r boxplot(logMass ~ Aquatic, data = bird, names = c("Non-Aquatic", "Aquatic")) ``` <img src="workshop04-en_files/figure-html/unnamed-chunk-34-1.png" width="468" style="display: block; margin: auto;" /> --- ## Running a T-test in R Next, test the assumption of equality of variance using `var.test()` ```r var.test(logMass ~ Aquatic, data = bird) # # F test to compare two variances # # data: logMass by Aquatic # F = 1.0725, num df = 38, denom df = 14, p-value = 0.9305 # alternative hypothesis: true ratio of variances is not equal to 1 # 95 percent confidence interval: # 0.3996428 2.3941032 # sample estimates: # ratio of variances # 1.072452 ``` .comment[The ratio of variances is not statistically different from 1, therefore variances are equal] .comment[We may now proceed with the t-test!] --- ## Running a T-test in R ```r ttest1 <- t.test(logMass ~ Aquatic, var.equal = TRUE, data = bird) # Or use lm() ttest.lm1 <- lm(logMass ~ Aquatic, data=bird) ``` .comment[Indicates that homogeneity of variance was respected (as we just tested)] You can verify that `t.test()` and `lm()` provide the same model: ```r ttest1$statistic^2 # t # 60.3845 anova(ttest.lm1)$F # [1] 60.3845 NA # answer: F=60.3845 in both cases ``` .comment[When the assumption of equal variance is met `\(t^2\)` follows an F distribution] --- ## Running a T-test in R If `\(p<0.01\)` (or `\(0.05\)` ), the null hypothesis of no difference between the two groups (*H0*) can be rejected, with a risk of `\(0.01\)` (or `\(0.05\)` ) that we made a mistake in this conclusion ```r ttest1 # # Two Sample t-test # # data: logMass by Aquatic # t = -7.7707, df = 52, p-value = 2.936e-10 # alternative hypothesis: true difference in means is not equal to 0 # 95 percent confidence interval: # -1.6669697 -0.9827343 # sample estimates: # mean in group 0 mean in group 1 # 1.583437 2.908289 ``` .small[.comment[There exists a difference in mass between the aquatic and terrestrial birds - `p-value`]] .small[.comment[Look at the mean of the two groups]] --- ## Violation of Assumptions - If variances between groups are not equal, can use corrections like the Welch correction (DEFAULT in R!) - If assumptions cannot be respected, the **non-parametric** equivalent of t-test is the Mann-Whitney test - If two groups **are not independent** (e.g. measurements on the same individual at 2 different years), you should use a paired t-test --- ## Group discussion .large[Are aquatic birds heavier than terrestrial birds?] ```r # Unilateral t-test uni.ttest1 <- t.test(logMass ~ Aquatic, var.equal = TRUE, data = bird, alternative = "less") ``` .comment[What did you conclude?] --- ## Group discussion ```r uni.ttest1 # # Two Sample t-test # # data: logMass by Aquatic # t = -7.7707, df = 52, p-value = 1.468e-10 # alternative hypothesis: true difference in means is less than 0 # 95 percent confidence interval: # -Inf -1.039331 # sample estimates: # mean in group 0 mean in group 1 # 1.583437 2.908289 ``` .small[ Yes, aquatic birds are heavier than terrestrial birds: p-value = 0.0000000001468087 ] --- class: inverse, center, middle # ANOVA --- ## Analysis of Variance (ANOVA) Generalization of the t-test to `\(>2\)` groups and/or `\(≥2\)` factor levels Subsets variation in the response variable into additive effects of one or several factors and the interactions between them <br> `$$Y = \underbrace{\mu}_{\Large{\text{The average outcome}\atop\text{over all individuals}}} + \overbrace{\tau_{i}}^{\Large{\text{The average outcome over}\atop\text{all individuals in group i}}} + \underbrace{\epsilon}_{\text{Residuals}}$$` --- ## Review: ANOVA Assumptions - Normality of residuals - Equality of variance between groups Complementary test - When ANOVA detects a significant difference between groups, it does not tell you which group differs from which other group - A commonly used post-hoc test to answer this question is the **Tukey's test** --- ## Running an ANOVA in R ##### Is abundance a function of diet? - Response variable: **MaxAbund**  num: continuous - Explanatory variable: **Diet**  factor with 5 levels ```r str(bird) # 'data.frame': 54 obs. of 9 variables: # $ Family : Factor w/ 53 levels "Anhingas","Auks& Puffins",..: 18 25 23 21 2 10 1 44 24 19 ... # $ MaxAbund : num 2.99 37.8 241.4 4.4 4.53 ... # $ AvgAbund : num 0.674 4.04 23.105 0.595 2.963 ... # $ Mass : num 716 5.3 35.8 119.4 315.5 ... # $ Diet : Factor w/ 5 levels "Insect","InsectVert",..: 5 1 4 5 2 4 5 1 1 5 ... # $ Passerine : int 0 1 1 0 0 0 0 0 0 0 ... # $ Aquatic : int 0 0 0 0 1 1 1 0 1 1 ... # $ logMaxAbund: num 0.475 1.577 2.383 0.643 0.656 ... # $ logMass : num 2.855 0.724 1.554 2.077 2.499 ... ``` --- ## Visualize data First, visualize the data using `boxplot()` (alphabetically by default) ```r boxplot(logMaxAbund ~ Diet, data = bird, ylab = expression("log"[10]*"(Maximum Abundance)"), xlab = 'Diet') ``` <img src="workshop04-en_files/figure-html/unnamed-chunk-42-1.png" width="504" style="display: block; margin: auto;" /> --- ## Visualize data We can reorder factor levels according to group medians using the `tapply()` and `sort()` functions ```r med <- sort(tapply(bird$logMaxAbund, bird$Diet, median)) boxplot(logMaxAbund ~ factor(Diet, levels = names(med)), data = bird, ylab = expression("log"[10]*"(Maximum Abundance)"), xlab = 'Diet') ``` <img src="workshop04-en_files/figure-html/unnamed-chunk-43-1.png" width="504" style="display: block; margin: auto;" /> --- ## Visualize data Another way to graphically view the effect sizes is to use `plot.design()` ```r plot.design(logMaxAbund ~ Diet, data=bird, ylab = expression("log"[10]*"(Maximum Abundance)")) ``` <img src="workshop04-en_files/figure-html/unnamed-chunk-44-1.png" width="504" style="display: block; margin: auto;" /> .comment[Levels of a particular factor along a vertical line, and the overall value of the response in a horizontal line] --- ## Running a one-way ANOVA in R Can use the function `lm()` to run an ANOVA ```r anov1 <- lm(logMaxAbund ~ Diet, data = bird) ``` Or use a specific function called `aov()` ```r aov1 <- aov(logMaxAbund ~ Diet, data = bird) ``` .comment[Try it and compare the outputs!] --- ## Running a one-way ANOVA in R Compare outputs ```r anova(anov1) # Analysis of Variance Table # # Response: logMaxAbund # Df Sum Sq Mean Sq F value Pr(>F) # Diet 4 5.1059 1.27647 2.8363 0.0341 * # Residuals 49 22.0521 0.45004 # --- # Signif. codes: 0 '***' 0.001 '**' 0.01 '*' 0.05 '.' 0.1 ' ' 1 ``` ```r summary(aov1) # Df Sum Sq Mean Sq F value Pr(>F) # Diet 4 5.106 1.276 2.836 0.0341 * # Residuals 49 22.052 0.450 # --- # Signif. codes: 0 '***' 0.001 '**' 0.01 '*' 0.05 '.' 0.1 ' ' 1 ``` --- ## Did we violate the model assumptions? **Bartlett test**: equality of variance among groups .small[ ```r bartlett.test(logMaxAbund ~ Diet, data = bird) # # Bartlett test of homogeneity of variances # # data: logMaxAbund by Diet # Bartlett's K-squared = 7.4728, df = 4, p-value = 0.1129 ``` ] **Shapiro-Wilk test**: Normality of residuals .small[ ```r shapiro.test(resid(anov1)) # # Shapiro-Wilk normality test # # data: resid(anov1) # W = 0.97995, p-value = 0.4982 ``` ] .comment[Both tests are non-significant; variances assumed to be equal and residuals assumed to be normally distributed] --- ## What if the assumptions were not met? **Transform the data**: might normalize the residuals and homogenize the variances, and convert a multiplicative effect into an additive one ```r data$logY <- log10(data$Y) ``` * see Workshop 1 for rules on data transformation * re-run your data with the transformed variables and verify the assumptions once again **Kruskal-Wallis Test**: non-parametric equivalent to ANOVA if you cannot *(or do not wish to)* transform the data ```r kruskal.test(Y~X, data) ``` --- ## Output of our ANOVA model Factor levels in alphabetical order and all levels are compared to the reference level (`Insect`) .small[ ```r summary(anov1) # # Call: # lm(formula = logMaxAbund ~ Diet, data = bird) # # Residuals: # Min 1Q Median 3Q Max # -1.85286 -0.32972 -0.08808 0.47375 1.56075 # # Coefficients: # Estimate Std. Error t value Pr(>|t|) # (Intercept) 1.1539 0.1500 7.692 5.66e-10 *** # DietInsectVert -0.6434 0.4975 -1.293 0.2020 # DietPlant 0.2410 0.4975 0.484 0.6303 # DietPlantInsect 0.4223 0.2180 1.938 0.0585 . # DietVertebrate -0.3070 0.2450 -1.253 0.2161 # --- # Signif. codes: 0 '***' 0.001 '**' 0.01 '*' 0.05 '.' 0.1 ' ' 1 # # Residual standard error: 0.6709 on 49 degrees of freedom # Multiple R-squared: 0.188, Adjusted R-squared: 0.1217 # F-statistic: 2.836 on 4 and 49 DF, p-value: 0.0341 ``` ] --- ## Output of our ANOVA model On the other hand, if `lm()` is used .pull-left2[ .small[ ```r summary.lm(aov1) # # Call: # aov(formula = logMaxAbund ~ Diet, data = bird) # # Residuals: # Min 1Q Median 3Q Max # -1.85286 -0.32972 -0.08808 0.47375 1.56075 # # Coefficients: # Estimate Std. Error t value Pr(>|t|) # (Intercept) 1.1539 0.1500 7.692 5.66e-10 *** # DietInsectVert -0.6434 0.4975 -1.293 0.2020 # DietPlant 0.2410 0.4975 0.484 0.6303 # DietPlantInsect 0.4223 0.2180 1.938 0.0585 . # DietVertebrate -0.3070 0.2450 -1.253 0.2161 # --- # Signif. codes: 0 '***' 0.001 '**' 0.01 '*' 0.05 '.' 0.1 ' ' 1 # # Residual standard error: 0.6709 on 49 degrees of freedom # Multiple R-squared: 0.188, Adjusted R-squared: 0.1217 # F-statistic: 2.836 on 4 and 49 DF, p-value: 0.0341 ``` ]] .pull-right2[ .comment[Significant difference between Diet groups, but we don't know which ones!] ] --- ## A posteriori test If ANOVA detects a significant effect, a post-hoc test is required to determine which treatment(s) differ from the others. This can be done with the `TukeyHSD()` function .pull-left2[ .small[ ```r TukeyHSD(aov(anov1), ordered = TRUE) # Tukey multiple comparisons of means # 95% family-wise confidence level # factor levels have been ordered # # Fit: aov(formula = anov1) # # $Diet # diff lwr upr p adj # Vertebrate-InsectVert 0.3364295 -1.11457613 1.787435 0.9645742 # Insect-InsectVert 0.6434334 -0.76550517 2.052372 0.6965047 # Plant-InsectVert 0.8844338 -1.01537856 2.784246 0.6812494 # PlantInsect-InsectVert 1.0657336 -0.35030287 2.481770 0.2235587 # Insect-Vertebrate 0.3070039 -0.38670951 1.000717 0.7204249 # Plant-Vertebrate 0.5480043 -0.90300137 1.999010 0.8211024 # PlantInsect-Vertebrate 0.7293041 0.02128588 1.437322 0.0405485 # Plant-Insect 0.2410004 -1.16793813 1.649939 0.9884504 # PlantInsect-Insect 0.4223003 -0.19493574 1.039536 0.3117612 # PlantInsect-Plant 0.1812999 -1.23473664 1.597336 0.9961844 ``` ] ] .pull-right2[ <br><br> .comment[Only "Vertebrate" and "PlantInsect" differ] ] --- ## Graphical representation The ANOVA results can be graphically illustrated using the `barplot()` function .small[ ```r sd <- tapply(bird$logMaxAbund, list(bird$Diet), sd) means <- tapply(bird$logMaxAbund, list(bird$Diet), mean) n <- length(bird$logMaxAbund) se <- 1.96*sd/sqrt(n) bp <- barplot(means, ylim = c(0, max(bird$logMaxAbund) - 0.5)) epsilon = 0.1 segments(bp, means - se, bp, means + se, lwd=2) # vertical bars segments(bp - epsilon, means - se, bp + epsilon, means - se, lwd = 2) # horizontal bars segments(bp - epsilon, means + se, bp + epsilon, means + se, lwd = 2) # horizontal bars ``` <img src="workshop04-en_files/figure-html/unnamed-chunk-56-1.png" width="504" style="display: block; margin: auto;" /> ] --- class: inverse, center, middle # Two-way ANOVA --- ## Two-way ANOVA More than one factor - One factor anova: `aov <- lm(Y ~ X, data)` - Two or more factors anova: `aov <- lm(Y ~ X * Z * ..., data)` .comment[The "*" symbol indicates that the main effects as well as their interaction will be included in the model] .comment[If use the "+" symbol, the main effects, but not their interaction are included] `aov <- lm(Y ~ X + Z + ..., data)` --- ## Two-way ANOVA Example of a non-significant interaction .small[ ```r aov <- lm(Y ~ X * Z, data) summary(aov) # Analysis of Variance Table # # Response: Y # Df Sum Sq Mean Sq F value Pr(>F) # X 4 5.1059 1.27647 3.0378 0.02669 * # Z 1 0.3183 0.31834 0.7576 0.38870 # X:Z 3 2.8250 0.94167 2.2410 0.10689 # Residuals 45 18.9087 0.42019 # --- # Signif. codes: 0 ‘***’ 0.001 ‘**’ 0.01 ‘*’ 0.05 ‘.’ 0.1 ‘ ’ 1 ``` ] According to law of **parsimony**, select model that explain the most variance with the least model parameters possible - Thus, remove the interaction term if non-signficant and re-evaluate ```r aov <- lm(Y ~ X + Z, data) ``` --- ## Challenge 2 ![:cube]() Evaluate how `log(MaxAbund)` varies with Diet and Aquatic - .comment[Hint: Test the factors Diet, Aquatic and their interaction in a two-way ANOVA model e.g. `lm(Y ~ A*B)`] - .comment[where A is your first factor, B is your second and ` * ` is the command for interaction in R] --- ## Challenge 2 - Solution ![:cube]() .small[ ```r anov2 <- lm(logMaxAbund ~ Diet*Aquatic, data = bird) summary(anov2) # # Call: # lm(formula = logMaxAbund ~ Diet * Aquatic, data = bird) # # Residuals: # Min 1Q Median 3Q Max # -1.9508 -0.2447 0.0000 0.3584 1.1558 # # Coefficients: (1 not defined because of singularities) # Estimate Std. Error t value Pr(>|t|) # (Intercept) 1.23447 0.17324 7.126 6.64e-09 *** # DietInsectVert -0.86989 0.67097 -1.296 0.2014 # DietPlant 0.16043 0.49001 0.327 0.7449 # DietPlantInsect 0.35358 0.23395 1.511 0.1377 # DietVertebrate -0.95449 0.33772 -2.826 0.0070 ** # Aquatic -0.26858 0.31630 -0.849 0.4003 # DietInsectVert:Aquatic 0.56034 0.96976 0.578 0.5663 # DietPlant:Aquatic NA NA NA NA # DietPlantInsect:Aquatic 0.05516 0.73821 0.075 0.9408 # DietVertebrate:Aquatic 1.24044 0.49408 2.511 0.0157 * # --- # Signif. codes: 0 '***' 0.001 '**' 0.01 '*' 0.05 '.' 0.1 ' ' 1 # # Residual standard error: 0.6482 on 45 degrees of freedom # Multiple R-squared: 0.3038, Adjusted R-squared: 0.18 # F-statistic: 2.454 on 8 and 45 DF, p-value: 0.02688 ``` ] --- ## Challenge 2 - Solution ![:cube]() .small[ ```r anov2 <- lm(logMaxAbund ~ Diet*Aquatic, data = bird) anova(anov2) # Analysis of Variance Table # # Response: logMaxAbund # Df Sum Sq Mean Sq F value Pr(>F) # Diet 4 5.1059 1.27647 3.0378 0.02669 * # Aquatic 1 0.3183 0.31834 0.7576 0.38870 # Diet:Aquatic 3 2.8250 0.94167 2.2410 0.09644 . # Residuals 45 18.9087 0.42019 # --- # Signif. codes: 0 '***' 0.001 '**' 0.01 '*' 0.05 '.' 0.1 ' ' 1 ``` ] .comment[In this case, the only significant term of the model is the diet factor] --- ## Learning objectives .center[ 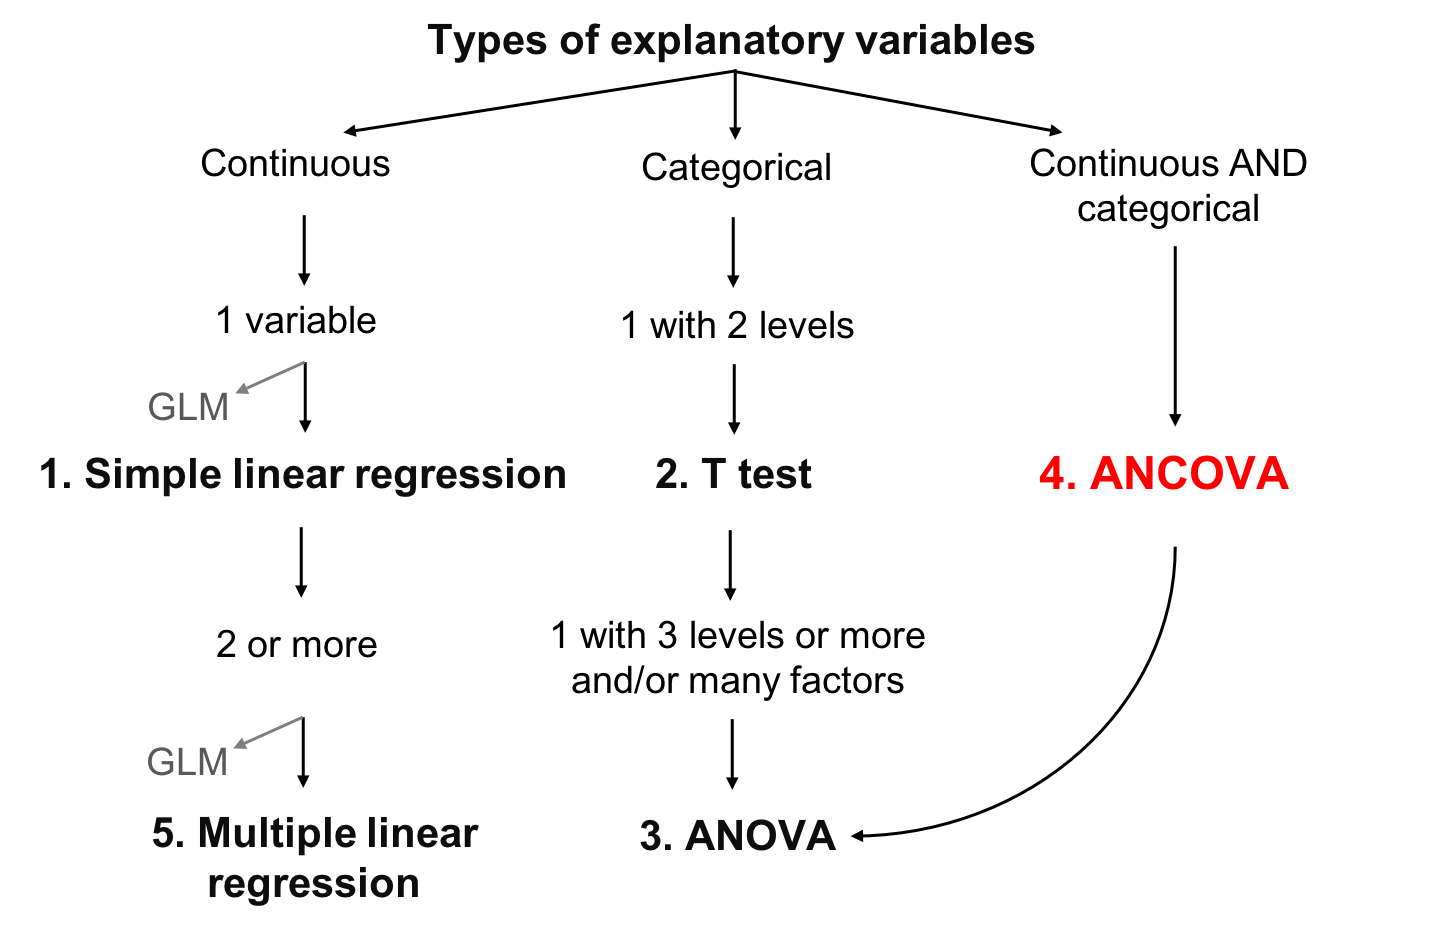 ] --- class: inverse, center, middle # ANCOVA --- ## Analysis of Covariance (ANCOVA) - Combination of ANOVA and linear regression - Explanatory variables are a mix of continuous variable(s) (covariates) and categorial variable(s) (factors) `$$Y = \mu + \text{Main Effects of Factors} + \\ \text{Interactions between factors} + \\ \text{Main effects of covariates} + \\ \text{Interactions between covariates and factors} + \epsilon$$` --- ## Review: ANCOVA In addition to the assumptions of linear models, **ANCOVA** models must have: - The same value range for all covariates - Variables that are fixed - No interaction between categorical and continuous variables <br> .small[ .comment[A **fixed** variable is one that you are specifically interested in (bird mass) whereas a **random** variable is noise that you want to control for (i.e. site a bird was sampled in)]] .small[.comment[*More in workshop 6 with linear-mixed effects models*]] --- ## Types of ANCOVA You can have any number of factors and/or covariates, but as their number increases, the interpretation of results gets more complex <br> Frequently used ANCOVA 1. **One covariate and one factor** 2. One covariate and two factors 3. Two covariates and one factor .small[.comment[We will only see the first case today, but the two others are pretty similar!]] --- ## ANCOVA with 1 covariate and 1 factor Different possible goals of this analysis: 1. Effect of factor and covariate on the response variable 2. Effect of factor on the response variable after removing effect of covariate 3. Effect of covariate on response variable while controlling for the effect of factor <br> .center[.alert[You can only meet these goals if you have no interaction between your factor and covariate!]] --- ## ANCOVA with 1 covariate and 1 factor <br> <img src="workshop04-en_files/figure-html/unnamed-chunk-59-1.png" width="720" style="display: block; margin: auto;" /> .pull-left2[.center[.pull-left[] .pull-right[]]] .pull-right2[.center[]] .center[.pull-left2[If the interaction is significant, you will have a scenario that looks like these]] .pull-right2[If your covariate and factor are significant, outputs will look like this] --- ## Compare ANCOVA - Adjusted means To compare the mean values of each factor, conditional on the effect of the other The `effect()` function uses the output of the ANCOVA model to estimate the means of each factor level, corrected by the effect of the covariate .small[ ```r ancova.exemple <- lm(Y ~ X*Z, data=data) # X = quantitative; Z = categorical library(effects) adj.means.ex <- effect('Z', ancova.exemple) plot(adj.means.ex) ``` ] <img src="workshop04-en_files/figure-html/unnamed-chunk-61-1.png" width="360" style="display: block; margin: auto;" /> --- ## ANCOVA with 1 covariate and 1 factor - If only your factor is significant, remove the covariate -> you will have a simple **ANOVA** - If only your covariate is significant, remove your factor -> you will have a **simple linear regression** - If the interaction btw your covariate and factor (*) is significant, you should explore which levels of the factor have different slopes from the others .alert[Verify assumptions!] - Very similar to what we have done so far! --- ## Running an ANCOVA in R ##### Is `Max Abund` a function of Diet and Mass? Response variable: **MaxAbund**  num : quantitative continuous Explanatory variables: - **Diet**  factor with 5 levels - **Mass**  numeric continuous ```r str(bird) # 'data.frame': 54 obs. of 9 variables: # $ Family : Factor w/ 53 levels "Anhingas","Auks& Puffins",..: 18 25 23 21 2 10 1 44 24 19 ... # $ MaxAbund : num 2.99 37.8 241.4 4.4 4.53 ... # $ AvgAbund : num 0.674 4.04 23.105 0.595 2.963 ... # $ Mass : num 716 5.3 35.8 119.4 315.5 ... # $ Diet : Factor w/ 5 levels "Insect","InsectVert",..: 5 1 4 5 2 4 5 1 1 5 ... # $ Passerine : int 0 1 1 0 0 0 0 0 0 0 ... # $ Aquatic : int 0 0 0 0 1 1 1 0 1 1 ... # $ logMaxAbund: num 0.475 1.577 2.383 0.643 0.656 ... # $ logMass : num 2.855 0.724 1.554 2.077 2.499 ... ``` --- ## Challenge 3 ![:cube]() 1- Run an ANCOVA to test the effect of Diet and Mass (as well as their interaction) on Maximum abundance ```r ancova.exemple <- lm(Y~X*Z, data=data) summary(ancova.exemple) ``` 2- Test whether the interaction is signifiant ```r ancova.exemple2 <- lm(Y~X+Z, data=data) summary(ancova.exemple2) ``` --- ## Challenge 3 - Solution ![:cube]() <br> ```r ancov1 <- lm(logMaxAbund ~ logMass*Diet, data = bird) anova(ancov1) # Analysis of Variance Table # # Response: logMaxAbund # Df Sum Sq Mean Sq F value Pr(>F) # logMass 1 1.9736 1.97357 4.6054 0.03743 * # Diet 4 3.3477 0.83691 1.9530 0.11850 # logMass:Diet 4 2.9811 0.74527 1.7391 0.15849 # Residuals 44 18.8556 0.42854 # --- # Signif. codes: 0 '***' 0.001 '**' 0.01 '*' 0.05 '.' 0.1 ' ' 1 ``` .comment[Interaction between `logMass` and `Diet` is non-significant] --- ## Challenge 3 - Solution ![:cube]() Remove the interaction term and re-evaluate the model (with only the main effects of `Diet` and `logMass`) ```r ancov2 <- lm(logMaxAbund ~ logMass + Diet, data = bird) anova(ancov2) # Analysis of Variance Table # # Response: logMaxAbund # Df Sum Sq Mean Sq F value Pr(>F) # logMass 1 1.9736 1.97357 4.3382 0.04262 * # Diet 4 3.3477 0.83691 1.8396 0.13664 # Residuals 48 21.8367 0.45493 # --- # Signif. codes: 0 '***' 0.001 '**' 0.01 '*' 0.05 '.' 0.1 ' ' 1 ``` --- ## Learning objectives .center[ 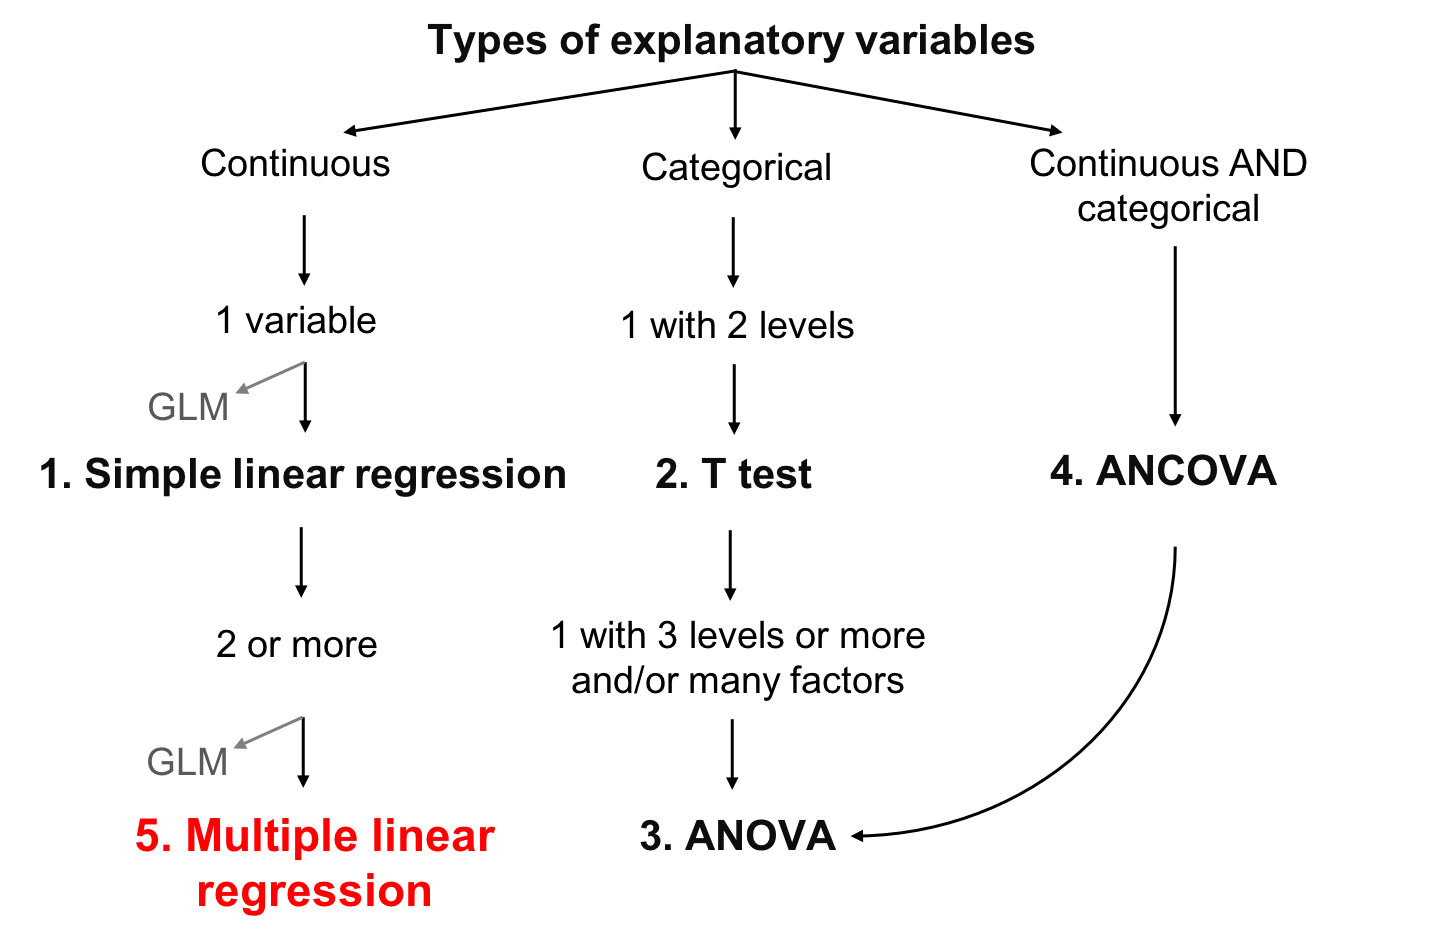 ] --- class: inverse, center, middle # Multiple linear regression --- ## Multiple linear regression - **Explanatory variable**  2 or more continuous variables - **Response variable**  1 continuous variable Generalization of simple linear regression .center[ `$$Y_i = \alpha + \beta_1x_{1i}+\beta_2x_{2i}+\beta_3x_{3i}+...+\beta_kx_{ki} + \epsilon$$` ] Assumptions (.small[*In addition to the usual assumptions of linear models*]) - Linear relationship between each explanatory variable and response variable - Explanatory variables are orthogonal (NO collinearity) If collinearity 1. Keep only one of the collinear variables 2. Try multidimensional analysis (workshop 9) 3. Try a pseudo-orthogonal analysis --- ## Multiple linear regression in R Using the `Dickcissel` datast to test effect of climate (`clTma`), productivity (`NDVI`) and grassland cover (`grass`) on bird abundance (`abund`) .small[ ```r Dickcissel = read.csv("data/dickcissel.csv") str(Dickcissel) # 'data.frame': 646 obs. of 15 variables: # $ abund : num 5 0.2 0.4 0 0 0 0 0 0 0 ... # $ Present : Factor w/ 2 levels "Absent","Present": 1 1 1 2 2 2 2 2 2 2 ... # $ clDD : num 5543 5750 5395 5920 6152 ... # $ clFD : num 83.5 67.5 79.5 66.7 57.6 59.2 59.5 51.5 47.4 46.3 ... # $ clTmi : num 9 9.6 8.6 11.9 11.6 10.8 10.8 11.6 13.6 13.5 ... # $ clTma : num 32.1 31.4 30.9 31.9 32.4 32.1 32.3 33 33.5 33.4 ... # $ clTmn : num 15.2 15.7 14.8 16.2 16.8 ... # $ clP : num 140 147 148 143 141 ... # $ NDVI : int -56 -44 -36 -49 -42 -49 -48 -50 -64 -58 ... # $ broadleaf: num 0.3866 0.9516 0.9905 0.0506 0.2296 ... # $ conif : num 0.0128 0.0484 0 0.9146 0.7013 ... # $ grass : num 0 0 0 0 0 0 0 0 0 0 ... # $ crop : num 0.2716 0 0 0.0285 0.044 ... # $ urban : num 0.2396 0 0 0 0.0157 ... # $ wetland : num 0 0 0 0 0 0 0 0 0 0 ... ``` ] --- ## Verify assumptions! Collinearity: - Verify collinearity of all explanatory variables and variables of interest .small[ .pull-left[ ```r # select variables var <- c('clTma', 'NDVI', 'grass', 'abund') plot(Dickcissel[, var]) ``` <img src="workshop04-en_files/figure-html/unnamed-chunk-68-1.png" width="504" style="display: block; margin: auto;" /> ]] .pull-right[ <br> .small[.comment[ If you see a pattern between any two variables, they may be collinear! They are likely to explain the same variability of the response variable and the effect of one variable will be masked by the other ]]] --- ## Multiple linear regression in R Run the multiple linear regression in R with `abund` as a function of `clTma + NDVI + grass` ```r lm.mult <- lm(abund ~ clTma + NDVI + grass, data = Dickcissel) summary(lm.mult) ``` Verify diagnostic plots, as you did for the simple linear regression ```r par(mfrow = c(2, 2)) plot(lm.mult) ``` --- ## Multiple linear regression in R Run the multiple linear regression in R with `abund` as a function of `clTma + NDVI + grass` .small[ ```r lm.mult <- lm(abund ~ clTma + NDVI + grass, data = Dickcissel) summary(lm.mult) # # Call: # lm(formula = abund ~ clTma + NDVI + grass, data = Dickcissel) # # Residuals: # Min 1Q Median 3Q Max # -35.327 -11.029 -4.337 2.150 180.725 # # Coefficients: # Estimate Std. Error t value Pr(>|t|) # (Intercept) -83.60813 11.57745 -7.222 1.46e-12 *** # clTma 3.27299 0.40677 8.046 4.14e-15 *** # NDVI 0.13716 0.05486 2.500 0.0127 * # grass 10.41435 4.68962 2.221 0.0267 * # --- # Signif. codes: 0 '***' 0.001 '**' 0.01 '*' 0.05 '.' 0.1 ' ' 1 # # Residual standard error: 22.58 on 642 degrees of freedom # Multiple R-squared: 0.117, Adjusted R-squared: 0.1128 # F-statistic: 28.35 on 3 and 642 DF, p-value: < 2.2e-16 ``` ] --- ## Multiple linear regression in R Verify diagnostic plots, as you did for the simple linear regression ```r par(mfrow = c(2, 2)) plot(lm.mult) ``` <img src="workshop04-en_files/figure-html/unnamed-chunk-72-1.png" width="432" style="display: block; margin: auto;" /> --- ## Find the best-fit model Recall the principle of parsimony: Most variance explained using the least number of terms possible  remove the weakest variable .pull-left2[ .small[ ```r summary(lm.mult) # # Call: # lm(formula = abund ~ clTma + NDVI + grass, data = Dickcissel) # # Residuals: # Min 1Q Median 3Q Max # -35.327 -11.029 -4.337 2.150 180.725 # # Coefficients: # Estimate Std. Error t value Pr(>|t|) # (Intercept) -83.60813 11.57745 -7.222 1.46e-12 *** # clTma 3.27299 0.40677 8.046 4.14e-15 *** # NDVI 0.13716 0.05486 2.500 0.0127 * # grass 10.41435 4.68962 2.221 0.0267 * # --- # Signif. codes: 0 '***' 0.001 '**' 0.01 '*' 0.05 '.' 0.1 ' ' 1 # # Residual standard error: 22.58 on 642 degrees of freedom # Multiple R-squared: 0.117, Adjusted R-squared: 0.1128 # F-statistic: 28.35 on 3 and 642 DF, p-value: < 2.2e-16 ``` ]] .pull-right2[ .small[.comment[ <br> All 3 variables are significant; Model explains ~11% of the dickcissel variance (R²-adj = 0.11) ]]] --- ## Find the best-fit model However, the response variable `abund` is not linearly related to the explanatory variables ```r plot(abund ~ clTma, data = Dickcissel) plot(abund ~ NDVI, data = Dickcissel) plot(abund ~ grass, data = Dickcissel) ``` <img src="workshop04-en_files/figure-html/unnamed-chunk-74-1.png" width="648" style="display: block; margin: auto;" /> .comment[See **Advanced section** on **polynomial regression** for solution!] --- class: inverse, center, middle # Optional section ## *if time permits* --- ## Optional section 1. Stepwise regression 2. Interpreting contrasts 3. Unbalanced ANOVA 4. Polynomial regression 5. Variance partitioning --- class: inverse, center, middle # Stepwise regression --- ## Stepwise regression Run a model with everything in except the "Present/ absence" variable Use `step()` to iteratively select the best model; - i.e. model with lowest Akaike's Information Criterion (AIC) .small[ ```r lm.full <- lm(abund ~ . - Present, data = Dickcissel) lm.step <- step(lm.full) ``` ] --- ## Stepwise regression .pull-left[ .tiny[ ```r summary(lm.full) # # Call: # lm(formula = abund ~ . - Present, data = Dickcissel) # # Residuals: # Min 1Q Median 3Q Max # -32.151 -9.847 -2.864 4.215 170.774 # # Coefficients: # Estimate Std. Error t value Pr(>|t|) # (Intercept) -444.39158 35.48446 -12.524 < 2e-16 *** # clDD 0.35577 0.33576 1.060 0.28973 # clFD 1.06739 0.17534 6.088 1.99e-09 *** # clTmi -6.73898 0.76207 -8.843 < 2e-16 *** # clTma 3.40939 1.34342 2.538 0.01139 * # clTmn -110.10517 122.81542 -0.897 0.37032 # clP 0.14624 0.05080 2.879 0.00413 ** # NDVI 0.01949 0.05446 0.358 0.72048 # broadleaf 1.38425 3.67225 0.377 0.70634 # conif 0.65936 4.02652 0.164 0.86998 # grass 10.66584 5.18745 2.056 0.04018 * # crop -0.86060 3.35285 -0.257 0.79751 # urban -31.01974 22.69841 -1.367 0.17224 # wetland 34.06486 806.29941 0.042 0.96631 # --- # Signif. codes: 0 '***' 0.001 '**' 0.01 '*' 0.05 '.' 0.1 ' ' 1 # # Residual standard error: 19.9 on 632 degrees of freedom # Multiple R-squared: 0.3248, Adjusted R-squared: 0.3109 # F-statistic: 23.39 on 13 and 632 DF, p-value: < 2.2e-16 ``` ]] .pull-right[ Variables selected by the `step()` function .tiny[ ```r summary(lm.step) # # Call: # lm(formula = abund ~ clDD + clFD + clTmi + clTma + clP + grass, # data = Dickcissel) # # Residuals: # Min 1Q Median 3Q Max # -30.913 -9.640 -3.070 4.217 172.133 # # Coefficients: # Estimate Std. Error t value Pr(>|t|) # (Intercept) -4.457e+02 3.464e+01 -12.868 < 2e-16 *** # clDD 5.534e-02 8.795e-03 6.292 5.83e-10 *** # clFD 1.090e+00 1.690e-01 6.452 2.19e-10 *** # clTmi -6.717e+00 7.192e-01 -9.339 < 2e-16 *** # clTma 3.172e+00 1.288e+00 2.463 0.014030 * # clP 1.562e-01 4.707e-02 3.318 0.000959 *** # grass 1.066e+01 4.280e+00 2.490 0.013027 * # --- # Signif. codes: 0 '***' 0.001 '**' 0.01 '*' 0.05 '.' 0.1 ' ' 1 # # Residual standard error: 19.85 on 639 degrees of freedom # Multiple R-squared: 0.3207, Adjusted R-squared: 0.3144 # F-statistic: 50.29 on 6 and 639 DF, p-value: < 2.2e-16 ``` ]] .small[.comment[The model now accounts for 31.44% of the Dickcissel abundance variability]] --- class: inverse, center, middle # Interpreting contrasts --- ## Interpreting contrasts DEFAULT: contrast compares each level of a factor to baseline level The intercept is the baseline group and corresponds to the mean of the first (alphabetically) Diet level (`Insect`) Add Intercept + coefficient estimates of each Diet level ```r tapply(bird$logMaxAbund, bird$Diet, mean) # Insect InsectVert Plant PlantInsect Vertebrate # 1.1538937 0.5104603 1.3948941 1.5761940 0.8468898 coef(anov1) # (Intercept) DietInsectVert DietPlant DietPlantInsect # 1.1538937 -0.6434334 0.2410004 0.4223003 # DietVertebrate # -0.3070039 coef(anov1)[1] + coef(anov1)[2] # InsectVert # (Intercept) # 0.5104603 coef(anov1)[1] + coef(anov1)[3] # Plant # (Intercept) # 1.394894 ``` .comment[What did you notice?] --- ## Interpreting contrasts We may want to relevel the baseline: 1. Compare the Plant diet to all other diet levels ```r bird$Diet2 <- relevel(bird$Diet, ref="Plant") anov2 <- lm(logMaxAbund ~ Diet2, data = bird) summary(anov2) anova(anov2) ``` 2. Reorder multiple levels according to median ```r bird$Diet2 <- factor(bird$Diet, levels=names(med)) anov2 <- lm(logMaxAbund ~ Diet2, data = bird) summary(anov2) anova(anov2) ``` .comment[Did you see change in the significance of each Diet level?] --- ## Interpreting contrasts .comment[NOTE: the DEFAULT contrast `contr.treatment` is NOT orthogonal] To be orthogonal: - Coefficients must sum to 0 - Any two contrast columns must sum to 0 ```r sum(contrasts(bird$Diet)[,1]) # [1] 1 sum(contrasts(bird$Diet)[,1]*contrasts(bird$Diet)[,2]) # [1] 0 ``` --- ## Interpreting contrasts Change the contrast to make levels orthogonal (e.g. Helmert contrast will contrast the second level with the first, the third with the average of the first two, and so on) .small[ ```r options(contrasts=c("contr.helmert", "contr.poly")) sum(contrasts(bird$Diet)[,1]) # [1] 0 sum(contrasts(bird$Diet)[,1]*contrasts(bird$Diet)[,2]) # [1] 0 ``` ] .tiny[ ```r anov3 <- lm(logMaxAbund ~ Diet, data = bird) summary(anov3) # # Call: # lm(formula = logMaxAbund ~ Diet, data = bird) # # Residuals: # Min 1Q Median 3Q Max # -1.85286 -0.32972 -0.08808 0.47375 1.56075 # # Coefficients: # Estimate Std. Error t value Pr(>|t|) # (Intercept) 1.09647 0.14629 7.495 1.14e-09 *** # Diet1 -0.32172 0.24876 -1.293 0.2020 # Diet2 0.18757 0.17854 1.051 0.2986 # Diet3 0.13911 0.06960 1.999 0.0512 . # Diet4 -0.06239 0.05238 -1.191 0.2393 # --- # Signif. codes: 0 '***' 0.001 '**' 0.01 '*' 0.05 '.' 0.1 ' ' 1 # # Residual standard error: 0.6709 on 49 degrees of freedom # Multiple R-squared: 0.188, Adjusted R-squared: 0.1217 # F-statistic: 2.836 on 4 and 49 DF, p-value: 0.0341 ``` ] --- class: inverse, center, middle # Unbalanced ANOVA --- ## Unbalanced ANOVA The `birdsdiet` data is actually unbalanced (number of `Aquatic` and `non-Aquatic` is not equal) ```r table(bird$Aquatic) # # 0 1 # 39 15 ``` Which means the order of the covariates changes the values of Sums of Squares ```r unb.anov1 <- lm(logMaxAbund ~ Aquatic + Diet, data = bird) unb.anov2 <- lm(logMaxAbund ~ Diet + Aquatic, data = bird) ``` --- ## Unbalanced ANOVA ```r anova(unb.anov1) # Analysis of Variance Table # # Response: logMaxAbund # Df Sum Sq Mean Sq F value Pr(>F) # Aquatic 1 0.2316 0.23157 0.5114 0.47798 # Diet 4 5.1926 1.29816 2.8671 0.03291 * # Residuals 48 21.7337 0.45279 # --- # Signif. codes: 0 '***' 0.001 '**' 0.01 '*' 0.05 '.' 0.1 ' ' 1 ``` ```r anova(unb.anov2) # Analysis of Variance Table # # Response: logMaxAbund # Df Sum Sq Mean Sq F value Pr(>F) # Diet 4 5.1059 1.27647 2.8191 0.03517 * # Aquatic 1 0.3183 0.31834 0.7031 0.40591 # Residuals 48 21.7337 0.45279 # --- # Signif. codes: 0 '***' 0.001 '**' 0.01 '*' 0.05 '.' 0.1 ' ' 1 ``` --- ## Unbalanced ANOVA Now try type III ANOVA using the `Anova()` function .pull-left[ .small[ ```r car::Anova(unb.anov1, type = "III") # Anova Table (Type III tests) # # Response: logMaxAbund # Sum Sq Df F value Pr(>F) # (Intercept) 18.9349 1 41.8186 4.837e-08 *** # Aquatic 0.3183 1 0.7031 0.40591 # Diet 5.1926 4 2.8671 0.03291 * # Residuals 21.7337 48 # --- # Signif. codes: 0 '***' 0.001 '**' 0.01 '*' 0.05 '.' 0.1 ' ' 1 ``` ]] .pull-right[ .small[ ```r car::Anova(unb.anov2, type = "III") # Anova Table (Type III tests) # # Response: logMaxAbund # Sum Sq Df F value Pr(>F) # (Intercept) 18.9349 1 41.8186 4.837e-08 *** # Diet 5.1926 4 2.8671 0.03291 * # Aquatic 0.3183 1 0.7031 0.40591 # Residuals 21.7337 48 # --- # Signif. codes: 0 '***' 0.001 '**' 0.01 '*' 0.05 '.' 0.1 ' ' 1 ``` ]] .comment[What have you noticed when using `Anova()`?]ff --- class: inverse, center, middle # Polynomial regression --- ## Polynomial regression As we noticed in the section on **multiple linear regression**, `MaxAbund` was non-linearly related to some variables To test for non-linear relationships, polynomial models of different degrees are compared. - A polynomial model looks like this: .center[$$\underbrace{2x^4}+\underbrace{3x}-\underbrace{2}$$] .comment[this polynomial has 3 terms] --- ## Polynomial regression For a polynomial with one variable (x), the *degree* is the largest exponent of that variable <br> .center[*this makes the degree 4*] `$$2x^\overbrace{4} + 3x - 2$$` --- ## Polynomial regression When you know a degree, you can also give it a name <table> <thead> <tr> <th style="text-align:right;"> Degree </th> <th style="text-align:left;"> Name </th> <th style="text-align:left;"> Example </th> </tr> </thead> <tbody> <tr> <td style="text-align:right;"> 0 </td> <td style="text-align:left;"> Constant </td> <td style="text-align:left;"> \(3\) </td> </tr> <tr> <td style="text-align:right;"> 1 </td> <td style="text-align:left;"> Linear </td> <td style="text-align:left;"> \(x+9\) </td> </tr> <tr> <td style="text-align:right;"> 2 </td> <td style="text-align:left;"> Quadratic </td> <td style="text-align:left;"> \(x^2-x+4\) </td> </tr> <tr> <td style="text-align:right;"> 3 </td> <td style="text-align:left;"> Cubic </td> <td style="text-align:left;"> \(x^3-x^2+5\) </td> </tr> <tr> <td style="text-align:right;"> 4 </td> <td style="text-align:left;"> Quartic </td> <td style="text-align:left;"> \(6x^4-x^3+x-2\) </td> </tr> <tr> <td style="text-align:right;"> 5 </td> <td style="text-align:left;"> Quintic </td> <td style="text-align:left;"> \(x^5-3x^3+x^2+8\) </td> </tr> </tbody> </table> --- ## Polynomial regression Using the `Dickcissel` dataset, test the non-linear relationship between max abundance and temperature by comparing three sets of nested polynomial models (of degrees 0, 1, and 3): ```r lm.linear <- lm(abund ~ clDD, data = Dickcissel) lm.quad <- lm(abund ~ clDD + I(clDD^2), data = Dickcissel) lm.cubic <- lm(abund ~ clDD + I(clDD^2) + I(clDD^3), data = Dickcissel) ``` --- ## Polynomial regression - Compare the polynomial models and determine which nested model we should keep - Run a summary of this model, report the regression formula, p-values and `\(R^2\)`-adj --- ## Polynomial regression Compare the polynomial models; .comment[which nested model we should keep?] Run a summary of this model, report the regression formula, p-values and `\(R^2\)`-adj .tiny[ ```r print(summ_lm.linear) # [1] "Coefficients:" # [2] " Estimate Std. Error t value Pr(>|t|) " # [3] "(Intercept) 1.864566 2.757554 0.676 0.49918 " # [4] "clDD 0.001870 0.000588 3.180 0.00154 **" # [5] "Multiple R-squared: 0.01546,\tAdjusted R-squared: 0.01393 " # [6] "F-statistic: 10.11 on 1 and 644 DF, p-value: 0.001545" ``` ```r print(summ_lm.quad) # [1] "Coefficients:" # [2] " Estimate Std. Error t value Pr(>|t|) " # [3] "(Intercept) -1.968e+01 5.954e+00 -3.306 0.001 ** " # [4] "clDD 1.297e-02 2.788e-03 4.651 4.00e-06 ***" # [5] "I(clDD^2) -1.246e-06 3.061e-07 -4.070 5.28e-05 ***" # [6] "Multiple R-squared: 0.04018,\tAdjusted R-squared: 0.0372 " # [7] "F-statistic: 13.46 on 2 and 643 DF, p-value: 1.876e-06" ``` ```r print(summ_lm.cubic) # [1] "Coefficients:" # [2] " Estimate Std. Error t value Pr(>|t|)" # [3] "(Intercept) -1.465e+01 1.206e+01 -1.215 0.225" # [4] "clDD 8.612e-03 9.493e-03 0.907 0.365" # [5] "I(clDD^2) -1.628e-07 2.277e-06 -0.071 0.943" # [6] "I(clDD^3) -8.063e-11 1.680e-10 -0.480 0.631" # [7] "Multiple R-squared: 0.04053,\tAdjusted R-squared: 0.03605 " # [8] "F-statistic: 9.04 on 3 and 642 DF, p-value: 7.202e-06" ``` ] --- class: inverse, center, middle # Variance Partitioning --- ## Variance Partitioning Some of the selected explanatory variables in the **multiple linear regression** section were highly correlated Collinearity between explanatory variables can be assessed using the variance inflation factor `vif()` function of package `car` - Variable with `VIF > 5` are considered collinearity ```r mod <- lm(clDD ~ clFD + clTmi + clTma + clP + grass, data = Dickcissel) car::vif(mod) # clFD clTmi clTma clP grass # 13.605855 9.566169 4.811837 3.196599 1.165775 ``` --- ## Variance Partitioning Use `varpart()` to partition the variance in max abundance with all land cover variables in one set and all climate variables in the other set (leaving out NDVI) .pull-left2[ .tiny[ ```r library(vegan) part.lm = varpart(Dickcissel$abund, Dickcissel[ ,c("clDD","clFD","clTmi","clTma","clP")], Dickcissel[ ,c("broadleaf","conif","grass","crop", "urban","wetland")]) part.lm # # Partition of variance in RDA # # Call: varpart(Y = Dickcissel$abund, X = Dickcissel[, c("clDD", # "clFD", "clTmi", "clTma", "clP")], Dickcissel[, c("broadleaf", # "conif", "grass", "crop", "urban", "wetland")]) # # Explanatory tables: # X1: Dickcissel[, c("clDD", "clFD", "clTmi", "clTma", "clP")] # X2: Dickcissel[, c("broadleaf", "conif", "grass", "crop", "urban", "wetland")] # # No. of explanatory tables: 2 # Total variation (SS): 370770 # Variance: 574.84 # No. of observations: 646 # # Partition table: # Df R.squared Adj.R.squared Testable # [a+b] = X1 5 0.31414 0.30878 TRUE # [b+c] = X2 6 0.03654 0.02749 TRUE # [a+b+c] = X1+X2 11 0.32378 0.31205 TRUE # Individual fractions # [a] = X1|X2 5 0.28456 TRUE # [b] 0 0.02423 FALSE # [c] = X2|X1 6 0.00327 TRUE # [d] = Residuals 0.68795 FALSE # --- # Use function 'rda' to test significance of fractions of interest ``` ]] .pull-right2[ <br><br> .small[.comment[**Note**: Collinear variables do not have to be removed prior to partitioning]] ] --- ## Variance Partitioning .pull-left[ ```r showvarparts(2) ``` <img src="workshop04-en_files/figure-html/unnamed-chunk-98-1.png" width="432" style="display: block; margin: auto;" /> .small[ ```r ?showvarparts # With two explanatory tables, the fractions # explained uniquely by each of the two tables # are ‘[a]’ and ‘[c]’, and their joint effect # is ‘[b]’ following Borcard et al. (1992). ``` ]] .pull-right[ ```r plot(part.lm, digits = 2, bg = rgb(48,225,210,80, maxColorValue=225), col = "turquoise4") ``` <img src="workshop04-en_files/figure-html/unnamed-chunk-100-1.png" width="432" style="display: block; margin: auto;" /> ] .small[.comment[Proportion of variance explained by climate alone is 28.5% (given by X1|X2), by land cover alone is ~0% (X2|X1), and by both combined is 2.4%]] --- ## Variance Partitioning Test significance of each fraction - Climate set ```r out.1 = rda(Dickcissel$abund, Dickcissel[ ,c("clDD", "clFD","clTmi","clTma","clP")], Dickcissel[ ,c("broadleaf","conif","grass","crop", "urban","wetland")]) ``` - Land cover set ```r out.2 = rda(Dickcissel$abund, Dickcissel[ ,c("broadleaf","conif","grass","crop", "urban", "wetland")], Dickcissel[ ,c("clDD","clFD","clTmi", "clTma","clP")]) ``` --- ## Variance Partitioning .pull-left[ .small[ ```r # Climate set anova(out.1, step = 1000, perm.max = 1000) # Permutation test for rda under reduced model # Permutation: free # Number of permutations: 999 # # Model: rda(X = Dickcissel$abund, Y = Dickcissel[, c("clDD", "clFD", "clTmi", "clTma", "clP")], Z = Dickcissel[, c("broadleaf", "conif", "grass", "crop", "urban", "wetland")]) # Df Variance F Pr(>F) # Model 5 165.12 53.862 0.001 *** # Residual 634 388.72 # --- # Signif. codes: 0 '***' 0.001 '**' 0.01 '*' 0.05 '.' 0.1 ' ' 1 ``` ]] .pull-right[ .small[ ```r # Land cover set anova(out.2, step = 1000, perm.max = 1000) # Permutation test for rda under reduced model # Permutation: free # Number of permutations: 999 # # Model: rda(X = Dickcissel$abund, Y = Dickcissel[, c("broadleaf", "conif", "grass", "crop", "urban", "wetland")], Z = Dickcissel[, c("clDD", "clFD", "clTmi", "clTma", "clP")]) # Df Variance F Pr(>F) # Model 6 5.54 1.5063 0.167 # Residual 634 388.72 ``` ]] .comment[Conclusion: the land cover fraction is non-significant once climate data is accounted for] --- class: inverse, center, bottom # Thank you for attending!